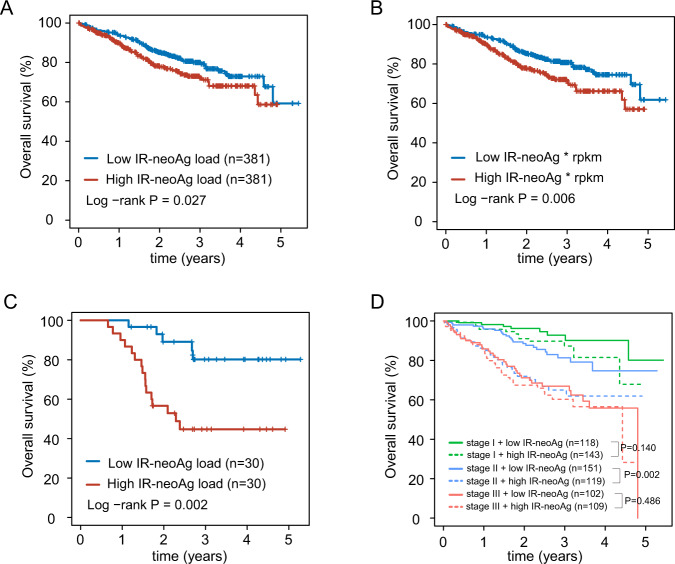
Fig. 3. Association of IR-neoAg load with overall survival in the MMRF cohort.
Kaplan–Meier survival curves comparing: A NDMM patients with high (defined as above the median) IR-neoAg load to those with low (below the median) IR-neoAg load; B NDMM patients with high or low expression levels of IR-neoAgs that were quantified using RPKM values of the source IR events; C MMRF patients with relapsed disease and either high or low IR-neoAg load; and D high and low IR-neoAg load subdivided by ISS disease stage.

