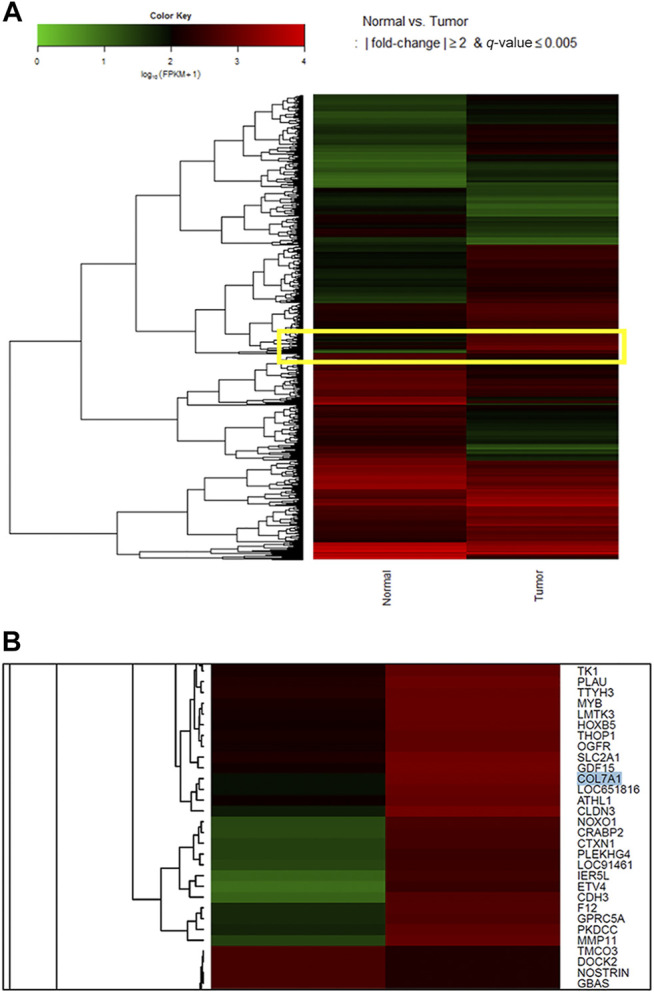
FIGURE 1.

Heatmap for log10 (fragments per kilobase of transcripts per million mapped reads, FPKM) values to compare gene expression across genes and samples. After pairing and clustering cancerous and noncancerous tissues, 1,662 differentially expressed genes were selected. During the functional annotation analysis, seven genes (COL1A1, COL7A1, CPA2, CPA3, PGA3, PGA4, and PGA5) were mappable to a protein digestion and absorption pathway (KEGG pathway: hsa 04,974). Among them, COL7A1 and COL1A1 were upregulated, and the others were downregulated [COL7A1: log2 (FC) = 3.679, p < 0.05, Q < 0.005; COL1A1: log2 (FC) = 3.281, p < 0.05, Q < 0.005]. When we focused on the genes in the yellow box (A), COL7A1 in cancer tissue was highly expressed in the heatmap (B). As COL7A1 was highly expressed in tumor tissues than in normal gastric tissues, we selected the gene as the target gene of our study. As for the color key, a log10 (FPKM+1) value of 1 is shown black because it is mostly the peak value of the FPKM density plot. For this plot, a value of 1 is added to the FPKM to avoid zero-based errors. Red squares, high expression; green squares, low expression; black squares, no difference.
