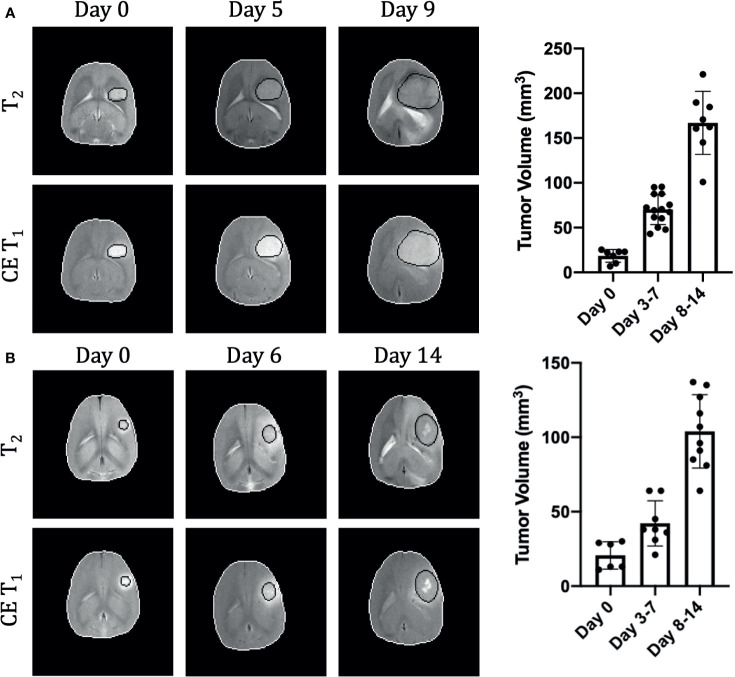
Figure 1.
Longitudinal growth characteristics of U87 (A) and U251 (B) tumors. T2 and contrast enhanced T1-weighted imaging contrasts are shown at three time points in the same tumor. The tumor is outlined in black and the brain in white. Tumor volume was measured across all imaging slices and quantified by multiplying the number of tumor voxels by the imaging spatial resolution and slice thickness. U87 data includes 29 timepoints from 15 animals and U251 data includes 23 timepoints from 13 animals.

