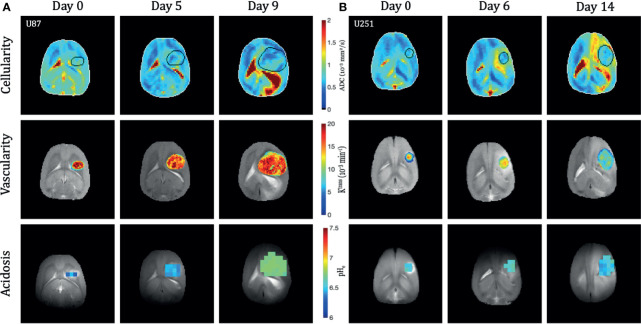
Figure 2.
Longitudinal multi-modal imaging of U87 (A) and U251 (B) tumors. The apparent diffusion coefficient (ADC) maps are shown as a reflection of cellularity, the Ktrans map from DCE is shown to reflect vascularity, and the pHe map from BIRDS is shown to reflect acidosis. All imaging was performed at three time points in the same tumor. The tumor was masked using T2-weighted and contrast-enhanced T1-weighted imaging. Vascular parameters from DCE and pHe from BIRDS were calculated in the masked tumors.

