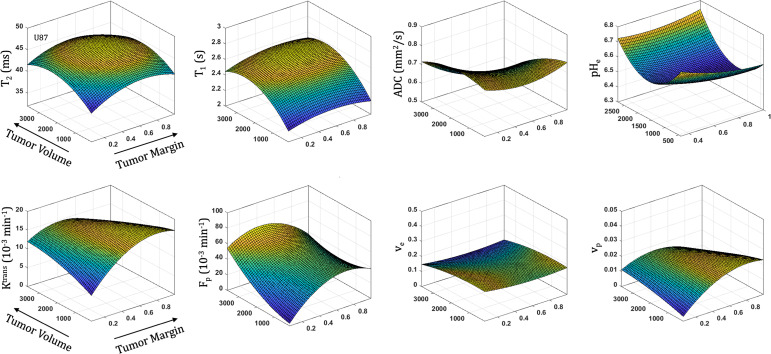
Figure 5.
Spatial and temporal variation in parameter measurements throughout U87 tumor progression. With progression, tumor volume increases. The spatial distribution is reflected as distance from tumor margin (0 is tumor margin, 1 is center of tumor). Cellularity (ADC), vascularity (Fp, Ktrans, ve, vp from DCE) and metabolism (pHe from BIRDS) as well as quantitative T2 and pre/post-contrast T1 parameter values are included. All imaging voxels across all timepoints and all tumors were fit to a 2nd order polynomial to illustrate the changing spatial parameter distributions with tumor progression.

