Figure 3.

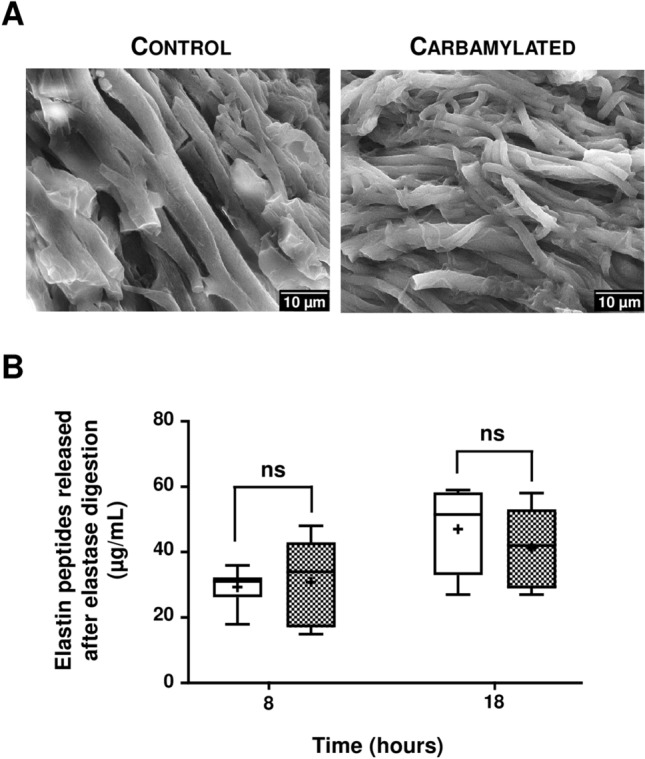
Impact of carbamylation on elastin morphology and sensitivity to elastase. (A) Representative SEM images of elastin extracted from bovine aorta and incubated with 100 mM NaCl (Control) or 100 mM NaCNO (Carbamylated) for 24 h at 37 °C. (B) Control (open boxes) and carbamylated (grey boxes) elastin samples were incubated with pancreatic elastase (0.1 UI/mL) for 8 and 18 h. Elastin peptides released into the supernatant after precipitation were quantified as described in “Methods” section. Results were expressed as μg/mL and presented as boxplots, in which the error bars represent minimum and maximum values, the horizontal bars and the crosses indicate median and mean values, respectively, and the extremities of the boxes indicate interquartile ranges. Values were compared using the non-parametric Mann–Whitney's U test (ns non significant).
