Figure 4.

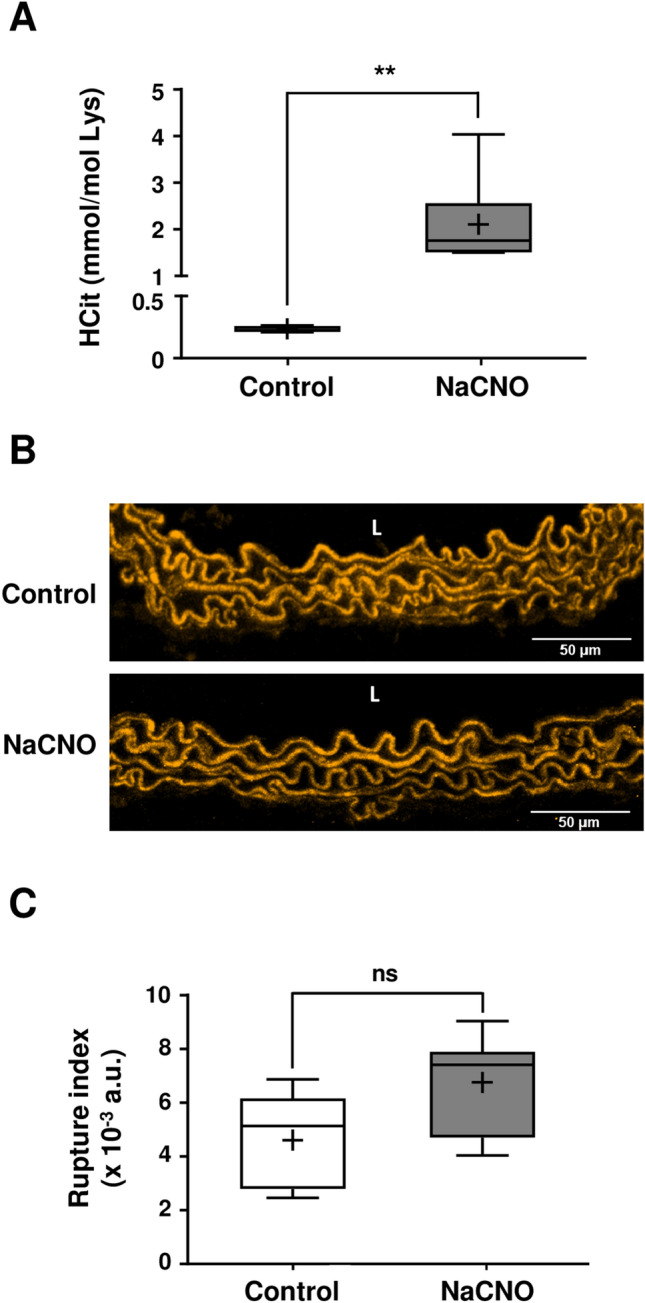
Properties of aortic elastic fibers after carbamylation enhancement in mice. (A) HCit was quantified by LC–MS/MS in total aorta extracts in WT mice drinking water supplemented with 1 mM NaCl (control) or 1 mM NaCNO (NaCNO) for 3 weeks. Results were expressed in mmol HCit per mol Lys. (B) Representative confocal images of aortic elastic fibers (using autofluorescence properties of elastin). L vessel lumen. (C) Elastic fiber degradation rates were expressed as rupture index corresponding to the ratio of the number of breaking points to the total area of elastic fibers. For (A) and (C), results were presented as boxplots, in which the error bars represent minimum and maximum values, the horizontal bars and the crosses indicate median and mean values, respectively, and the extremities of the boxes indicate interquartile ranges. Values were compared using the non-parametric Mann–Whitney's U test (ns not significant, **p < 0.01). a.u. arbitrary units.
