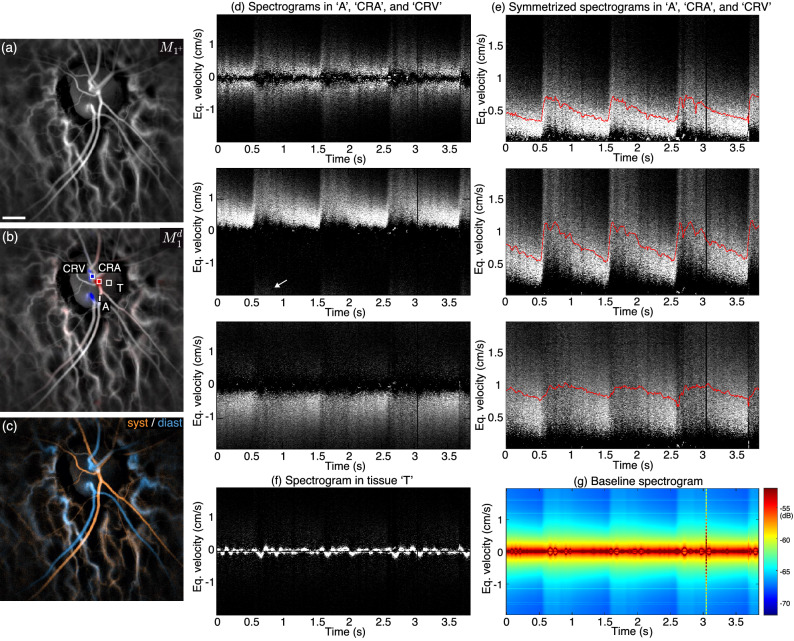
Figure 4.
Spectrographic flow measurements (healthy subject). (a,b) Blood flow and directional blood flow. (c) Color composite image of systolodiastolic blood flow changes. (d) Spectrograms in an in-plane artery (‘A’) where multiply scattered light contributes to the Doppler spectrum, and in the emergence of the central retinal artery (‘CRA’) and central retinal vein (‘CRV’) where backscattered light is the main contribution the Doppler spectrum. (e) Symmetrized spectrograms in the same regions. (f) The spectrogram in the region ‘T’ shows the ONH tissue motion. (g) Baseline spectrogram (spatial average). Visualization 1 shows the directional blood flow movie juxtaposed to the spectrogram in the ‘CRA’ region. The estimated size of the scale bar is 500m.

