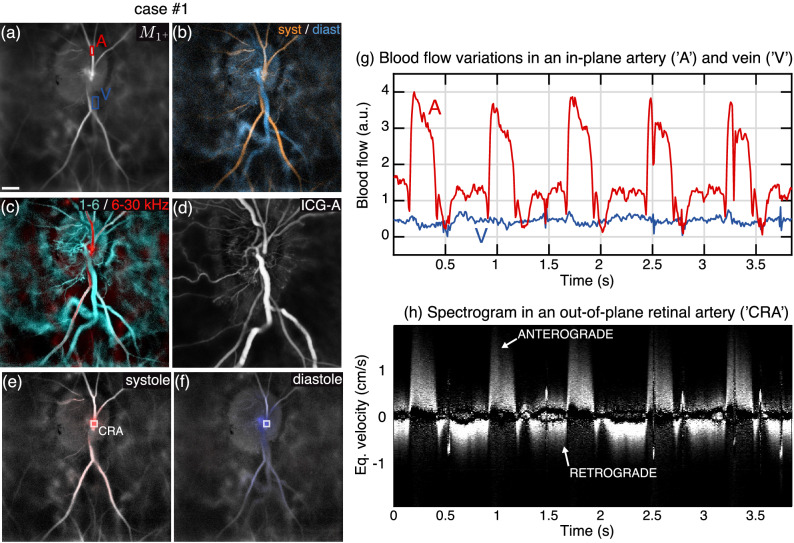
Figure 6.
Blood flow reversal in the central retinal artery in a case of high tension glaucoma/CRVO. (a) Averaged blood flow image. (b) Systolodiastolic image. (c) Color composite Doppler image of low/high flow in red/cyan. (d) ICG-Angiogram. (e,f) Directional blood flow during systole and diastole. (g) Blood flow measured in an in-plane artery ‘A’ and vein ‘V’. (h) Spectrogram measured in ‘CRA’. Visualization 3 shows the directional blood flow movie juxtaposed to the arterial spectrogram. Visualization 4 shows the dynamic ICG-angiography. The estimated size of the scale bar is 500 m.

