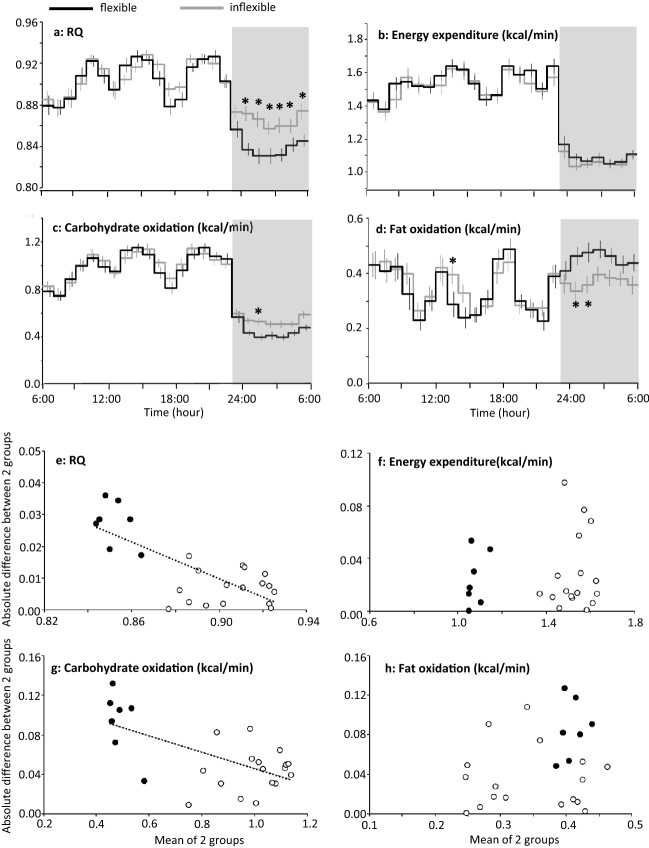
Figure 2.
24 h profile of energy metabolism in metabolically flexible and inflexible subjects. (a–d) Forty-one young men were grouped as metabolically flexible (n = 20) or inflexible (n = 21) according to the magnitude of range of RQ over the 24 h19–22. Subjects took breakfast (7:00 or 9:00), lunch (12:00, 12:30 or 13:00), and dinner (18:00), and slept for 7 h (23:00–06:00, grey bars). Mean ± SE of RQ, energy expenditure, carbohydrate oxidation and fat oxidation were shown for metabolically flexible (black lines) and inflexible (grey lines) group. A linear mixed-models ANOVA showed a significant effect of time (P < 0.01) and a group × time interaction (P < 0.01) but main effect of group was not significant for RQ (P = 0.145), carbohydrate oxidation (P = 0.420) and fat oxidation (P = 0.731). For energy expenditure, effect of time was significant (P < 0.01) but main effect of group (P = 0.726) and group × time interaction (P = 0.170) was not significant. *Represents significant difference between the 2 subgroups by post hoc pair-wise comparisons (P < 0.05). (e–h) Absolute differences between metabolically flexible and inflexible subgroup were plotted against mean of the two subgroups for RQ, energy expenditure, carbohydrate oxidation and fat oxidation. Values during sleep were shown as filled symbols (filled black circles). Significant negative correlation between absolute difference and mean of the two subgroups was observed in RQ and carbohydrate oxidation (P < 0.001).

