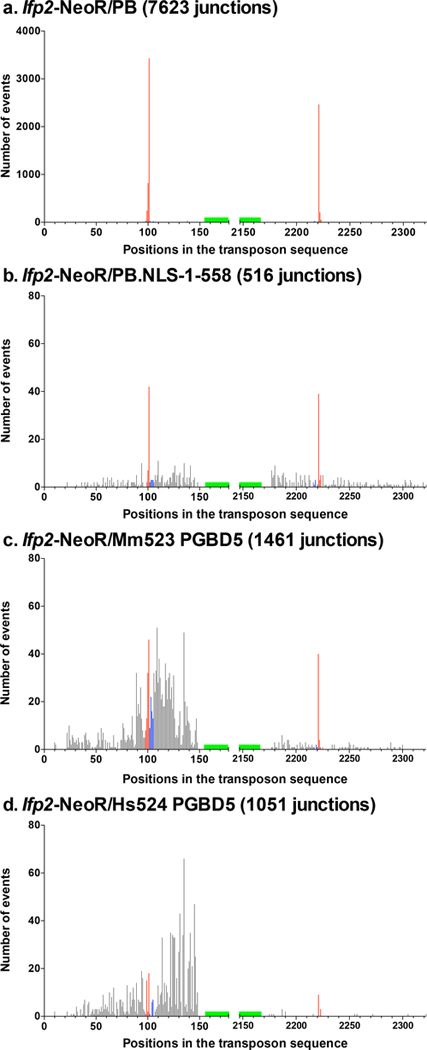
Fig. 3. Number and location of transposon breakpoints in pble sequences after transposition into chromosomes.
Histogram distributions of Ifp2-NeoR extremities transposed by PB (a), PB.NLS-1–558 (b), Mm523 (c) and Hs524 (d) (detailed in supplementary Tables 1 to 4). Red bars indicated insertion events with perfectly conserved TSD and TIR while blue bars located those in which TIR were perfectly conserved but the TSD did not correspond to a canonical TTAA at the outermost extremities of pbles. Black bars represented breakpoints within the transposon sequence and within plasmid backbone sequences juxtaposed to the transposon. Each bar corresponded to the number of junctions found at a single nucleotide position. Green boxes located the position of primers anchored within the transposon sequence and used at the last step of LAM-PCR. These graphics described the relative importance of wounds at transposon ends under our experimental conditions. However, they could not allow calculating wound rates at each of both ends due to the fact that the final LAM-PCR products in each dataset came from the gathering of several LAM-PCR reactions.

