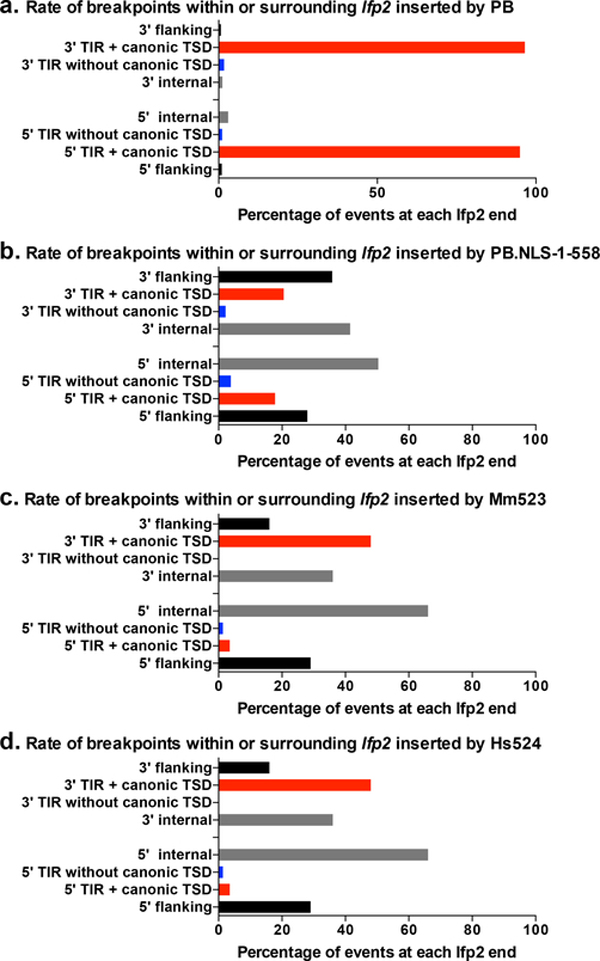
Fig. 6. Features of transposon breakpoints in Ifp2 transposed by PB (a), PB.NLS-1–558 (b), Mm523 (c) and Hs524 (d).
Black bars corresponded to percentages of breakpoints located within the plasmid backbone flanking the transposon or those located within inner transposon regions (from the position 2 in TIR to the primer used for the LAM-PCR). Red bars corresponded to those within transposons that displayed intact canonical TTAA TSD and TIRs. Blue bars corresponded to pbles displaying noncanonical TSD but intact TIRs.

