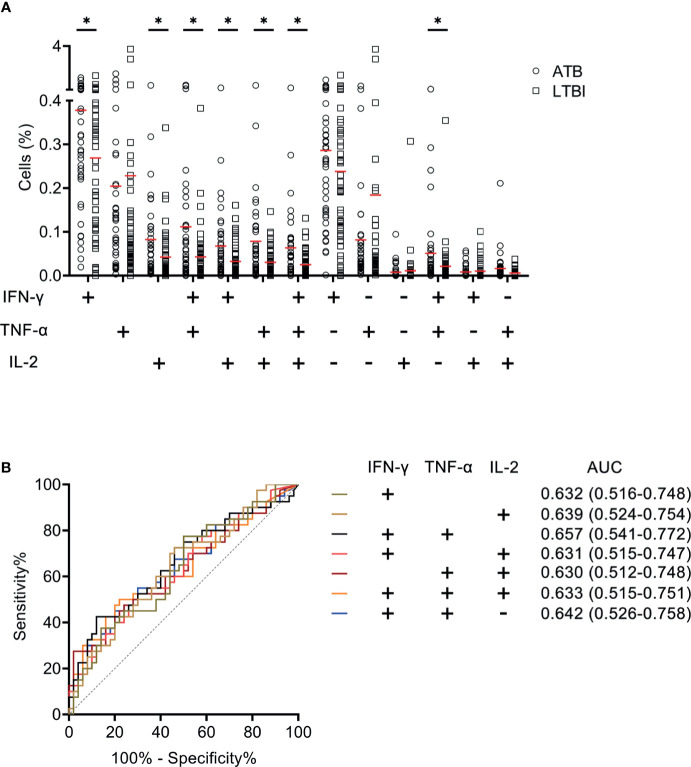
Figure 2.
The performance of various cytokine expression pattern upon MTB antigen stimulation in distinguishing ATB patients from LTBI individuals in Qiaokou cohort. (A) Aligned dot plots showing the results of the expression pattern of IFN-γ, TNF-α, and IL-2 upon MTB antigen stimulation in ATB patients and LTBI individuals. Horizontal lines indicate the medians. (B) ROC analysis showing the performance of various cytokine expression pattern in discriminating ATB patients from LTBI individuals. *P < 0.05 (Mann-Whitney U test). MTB, Mycobacterium tuberculosis; ATB, active tuberculosis; LTBI, latent tuberculosis infection; AUC, area under the curve.

