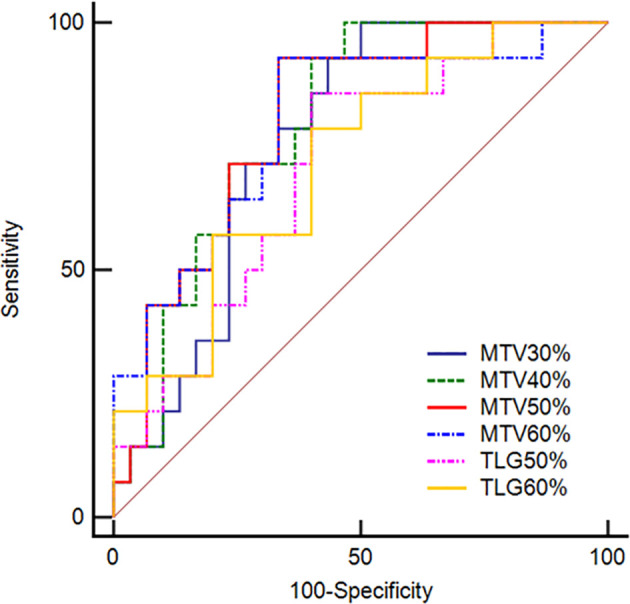
Figure 5.

Receiver operating characteristic curves of MTV30%, MTV40%, MTV50%, and MTV60% as well as TLG50% and TLG60% derived from PET/CT images for predicting MSI in CRC patients. The AUCs for predicting MSI from MSS were 0.764, 0.795, 0.805, and 0.795 for MTV30%, MTV40%, MTV50%, and MTV60%, respectively. In addition, the AUCs were 0.707 and 0.717 for TLG50% and TLG60%.
