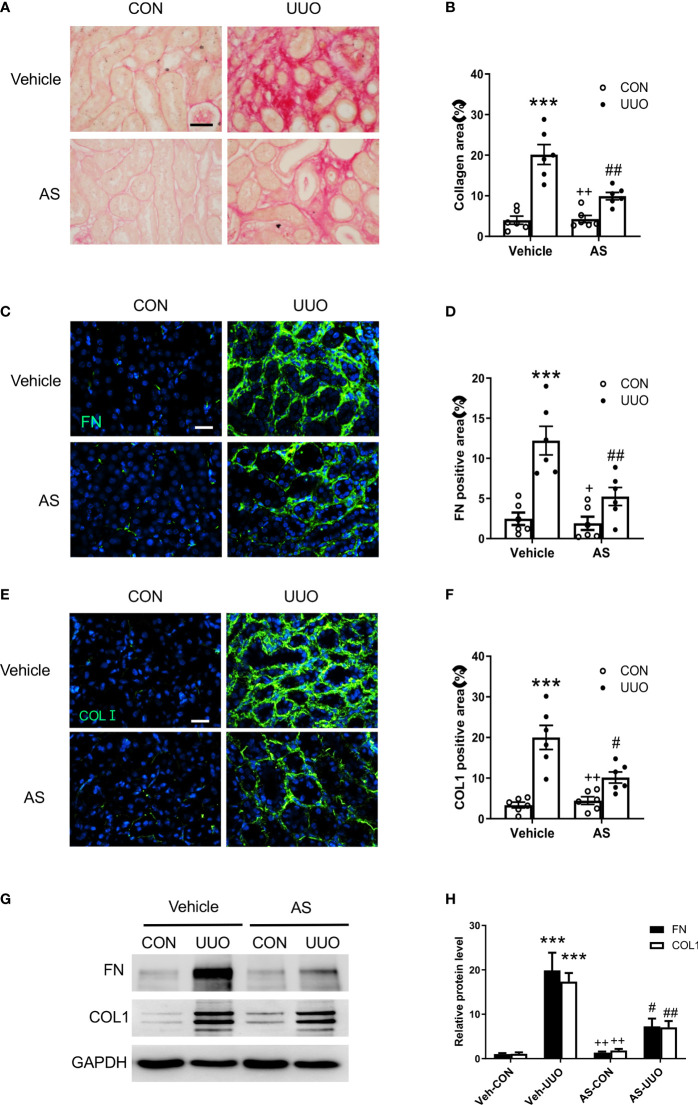
Figure 4.
AS1517499 attenuates renal fibrosis and ECM protein production in the kidney with obstructive injury. (A) Representative photomicrographs of kidney sections stained with Sirius red for evaluation of total collagen deposition in the kidney. Scale bar, 50μm. (B) Quantitative analysis of interstitial collagen deposition in the kidney. ***P <0.001 vs Vehicle-CON. ## P < 0.01 vs Vehicle-UUO, ++ P < 0.01 vs AS-UUO. n = 6 per group. (C) Representative photomicrographs of the kidney sections stained for fibronectin (green) and counterstained with DAPI (blue). Scale bar, 50μm. (D) Quantitative analysis of fibronectin-positive area in the kidney. ***P < 0.001 vs Vehicle-CON. ## P < 0.01 vs Vehicle-UUO, + P < 0.05 vs AS-UUO. n = 6 per group. (E) Representative photomicrographs of the kidney sections stained for collagen I (green) and counterstained with DAPI (blue). Scale bar, 50μm. (F) Quantitative analysis of collagen I positive area in the kidney. ***P < 0.001 vs Vehicle-CON. # P < 0.05 vs Vehicle-UUO, ++ P < 0.01 vs AS-UUO. n = 6 per group. (G) Representative Western blots show protein expression of fibronectin and collagen I in the kidney. (H) Quantitative analysis of protein levels of fibronectin and collagen I in the kidney. ***P < 0.001 vs Veh-CON; ## P < 0.01, # P < 0.05 vs Veh-UUO; ++ P < 0.01 vs AS-UUO. n = 6 per group.

