
Figure 5.
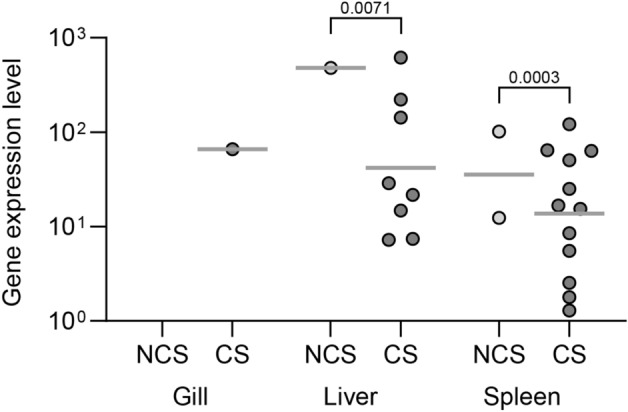
Level of A. salmonicida subsp. salmonicida gene (aopO) transcripts in different organs of fish at 3 days post challenge (dpc): NCS: exposed fish with no clinical signs, CS: exposed fish with clinical signs. Fifteen fish from each group were investigated. Number above the square brackets indicate p values between groups. For the NCS group, only few fish showed positive Cq values, therefore qualitative assessment was applied (presence or absence of Cq values) and data was analyzed with nonparametric Mann–Whitney test.