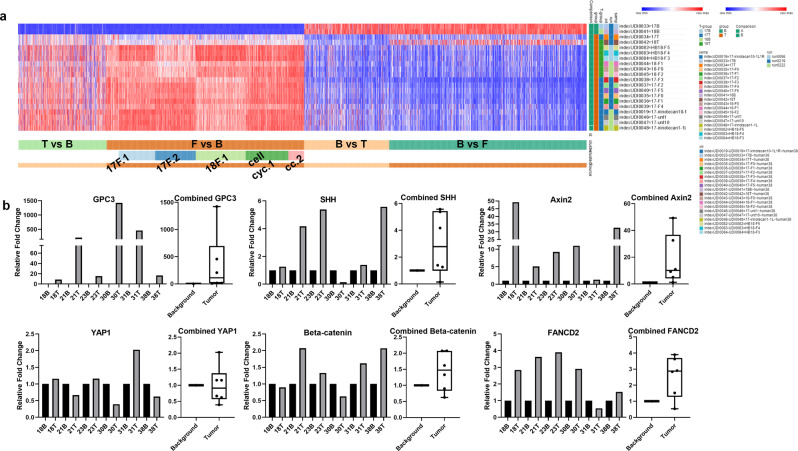
Fig. 2. RNAseq comparison of HB samples.
a Heat map to demonstrate the expression differences between human background liver, source tumor, and PDX tumor over time (passages F0–F5 demonstrate expansion of tumor through multiple sets of mice). Overexpressed genes in HB tumor are often overexpressed to a greater degree in PDX and genes with lower expression can demonstrate further reduction in PDX. PDX tumor maintains a similar gene expression profile through multiple passages. b Validation of upregulation in genes of interest. qRT-PCR validation of gene expression in human HB background liver (B) compared with tumor (T). Each number—B/T represents matched samples from one patient. GPC3 is overexpressed in T vs. B. YAP1 shows some elevation in T, but expression is variable. SHH is generally overexpressed in T. Beta-catenin (CTNNB1) is variable but generally has moderate elevation in T. AXIN2 and FANCD2 are elevated in many T samples and appear to correlate with PDX tumor-growth success.

