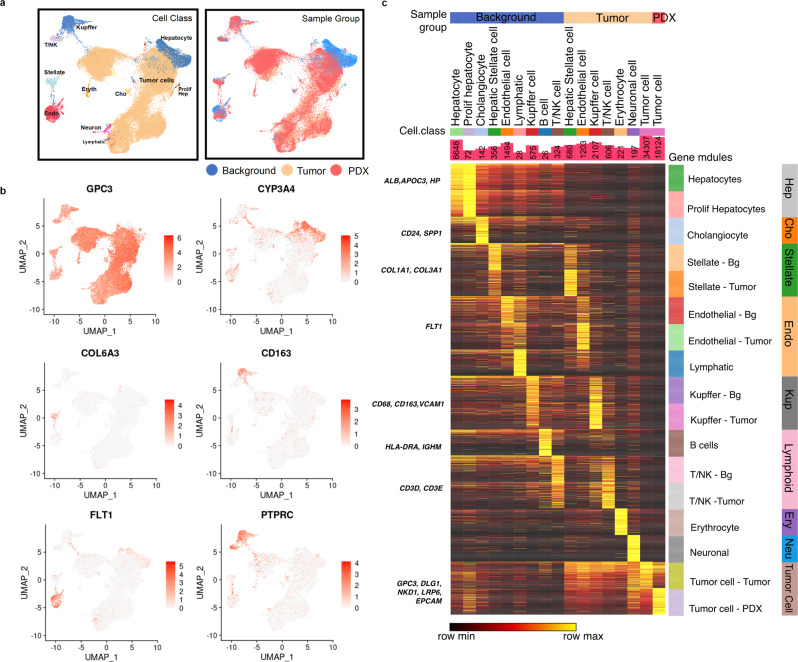
Fig. 3. Single-cell RNA sequencing characterization of background liver, tumor, and PDX.
a UMAP of cell classes (Left) and sample groups (Right) of the integrated data from background, tumor and PDX. Endo endothelial cell, Stellate hepatic stellate cell, Eryth erythrocyte, T/NK 774 T cell or NK cell, Cho cholangiocyte, Prolif Hep proliferative hepatocyte. b Marker genes for common cell populations in liver and tumor were drawn on UMAP. DLK1 shows tumor, HPGD identifies hepatocytes, FLT1 indicates epithelial cells, COL6A3 represents hepatic stellate cells, CD163 marks Kupffer cells, and PTPRC indicates immune cells. c The heatmap for 200 most upregulated genes for cell types within background liver, tumor, and PDX (Methods). Known markers were shown on the left. Cell counts are shown in bar charts.

