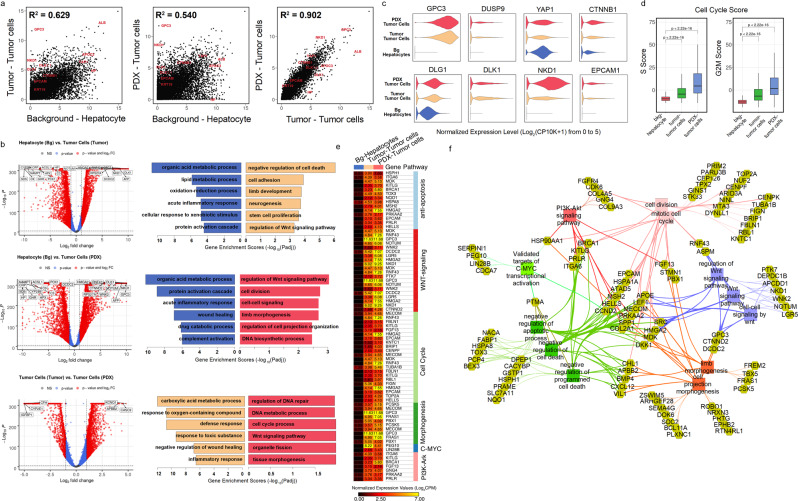
Fig. 4. Maintenance of features across the tumor and PDX.
a Scatter plots for normalized expression values of all detected genes in hepatocytes of background liver versus tumor cells of tumor (Left), hepatocyte of background liver versus tumor cells of PDX (Middle), and tumor cells of tumor versus tumor cells of PDX (Right). R-square values were calculated after fitting data into linear-regression models. Some markers of tumor cell and hepatocytes are highlighted. b Volcano plots (Left) and gene enrichment results for top 200 DEGs (Right) of comparisons in (A). Representative enriched pathways were shown, and gene enrichment scores were calculated using −Log10 (adjusted enrichment p value). c Violin plots showed distributions of normalized expression levels of several important tumor genes across background hepatocytes and tumor cells in tumor and PDX. d Cell cycle scores, including scores of phase S (Left) and G2M (Right) of three main cell types showed that tumor cells had significantly higher proliferation activities. e Genes involved in the upregulated pathways of tumor cells in (B) were shown on the heatmap (Table S5). Normalized expression values were used. f Functional association network showing upregulated genes of tumor cells in HB T and PDX and their associations with tumor development-related pathways in (b and e) using ToppCluster (Methods).

