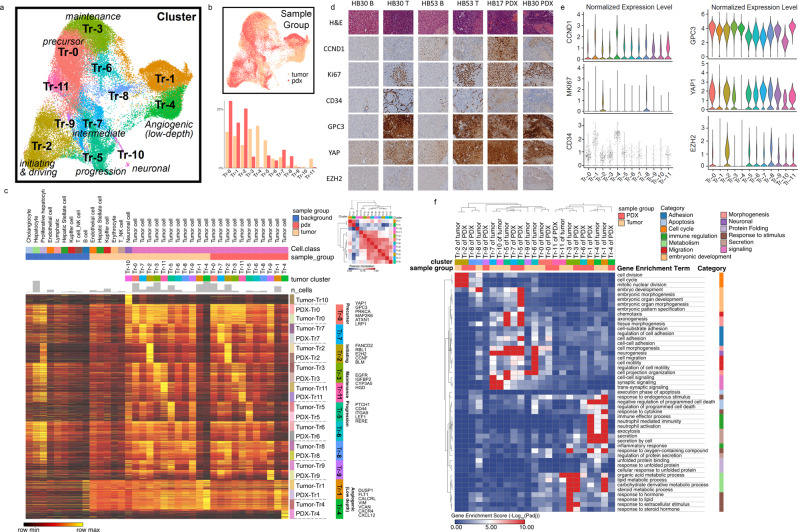
Fig. 5. Gene expression defines initiating cell potential and other functional roles in tumor cell clusters.
a The UMAP visualization showed the clusters found in the tumor cells from tumor and PDX after integration and reclustering. Cells in different states are labeled. Tr1 and Tr4 are clusters with relatively low sequencing depth. b UMAP visualization of sample-group distribution (Top) and percentages of clusters in each sample group (Bottom). c A heatmap was drawn for 200 most upregulated genes per tumor cluster in each sample group. Cell types in background liver and tumor microenvironment are shown as the reference. Normalized values were used for expression levels. Key signature genes in some clusters are shown on the right. Similarity matrix of tumor clusters was calculated with Pearson correlation based on a combined gene list from (c). Hierarchical clustering was applied for rows and columns. d IHC was conducted in B, T, and PDX samples from HB30, B and T from HB53, and PDX from HB17 to show localization of CCND1, KI67, CD34, GPC3, YAP, and EZH2 to differing regions of tumor (20X, scale bar 50 µM). e Violin plots of gene expression for the corresponding genes in (d) are shown to show the expression patterns in each tumor cluster. Dots are only shown in the violin plot of CD34 due to its relatively sparse expression in the single-cell data. f A heatmap of gene set enrichment scores (−log10Padj) of each cluster by ToppGene enrichment using genes in (c). Tumor-association enrichment terms in Gene Ontology (Biological Process) were selected and grouped into several categories. Hierarchical clustering was applied for rows and columns.

