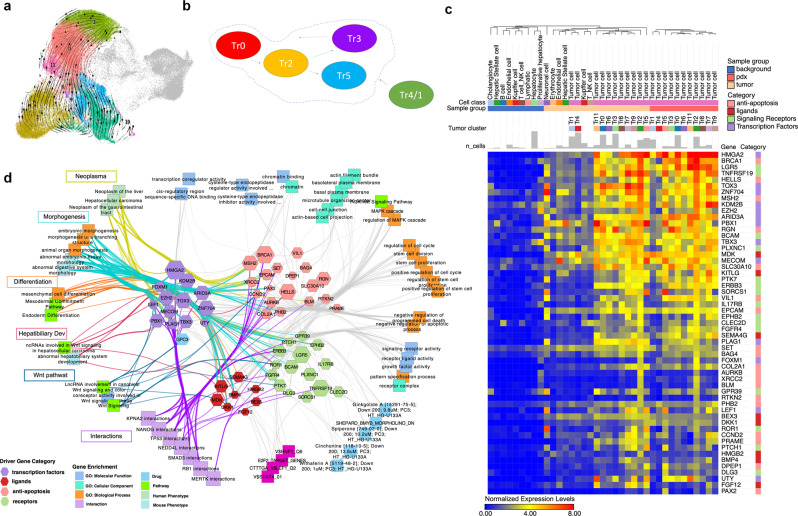
Fig. 6. Definition of cell-cluster progression and molecular targets.
a RNA velocity of tumor clusters is shown on the UMAP. Streams indicate the predicted tumor transitions across clusters (Methods). We only focused on clearly identified clusters and removed clusters with low sequencing depth (Tr1 and Tr4) since RNA velocity is easily biased by technical noise58. b Diagram of proposed tumor cell cluster progression from precursor (Tr0) to initiating cells (Tr2) to progression (Tr5) and maintenance cells (Tr3) with integration of potential angiogenic/endothelial cell population (Tr4). c Heatmap of potential driver or targetable gene sets in tumor cells, background liver, and tumor environment. Differentially and highly expressed (maximal row levels are greater than 0.5) anti-apoptosis genes, ligands, and receptor genes and transcription factors in tumor cells are selected and shown (GO:0043066: negative regulation of apoptotic process; GO:0048018: receptor-ligand activity; GO:0004888: transmembrane signaling receptor activity; GO:0000976: transcription-regulatory region sequence-specific DNA binding). Endo endothelial cells, Cho cholangiocytes, HSC hepatic stellate cells, Kup Kupffer cells, B B cells, NK NK cells, T T cells, Hep hepatocytes, Mono monocytes, T/NK T cells or NK cells. d Network showing driver genes (c) and associations with tumor-related terms enriched in ToppCluster. The size of hexagon indicates the gene expression level in tumor cluster Tr2. Key functional associations, such as morphogenesis and Wnt signaling pathway, are highlighted in different colors.

