Figure 4.
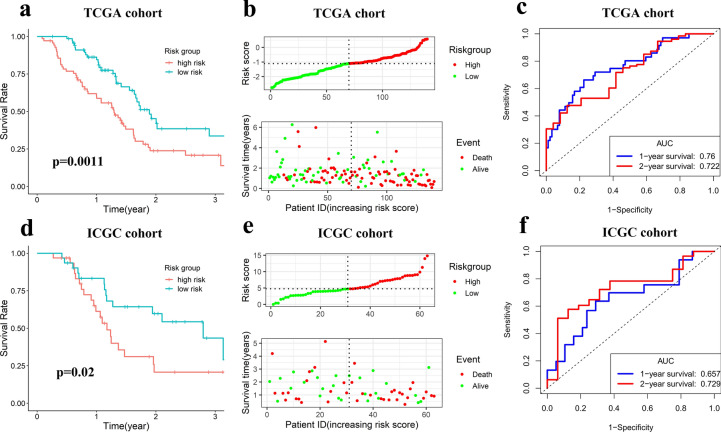
The m6A-related lncRNA prognostic riskscore (m6A-LPR) in the training cohort and validation cohort. (a) Kaplan–Meier curve showed that the high-risk group had worse overall survival than the low-risk group in the training cohort. (b) Distributions of risk scores based on the m6A-LPR and survival status of patients in the training cohort. (c) Receiver operating characteristic (ROC) curves of m6A-LPR for predicting the 1/2-year survival in the training cohort. (d) Kaplan–Meier curve showed that the high-risk group had worse overall survival than the low-risk group in the validation cohort. (e) Distributions of risk scores and survival status of patients in the validation cohort. (f) ROC curves of m6A-LPR for predicting 1/2-year survival in the validation cohort.

