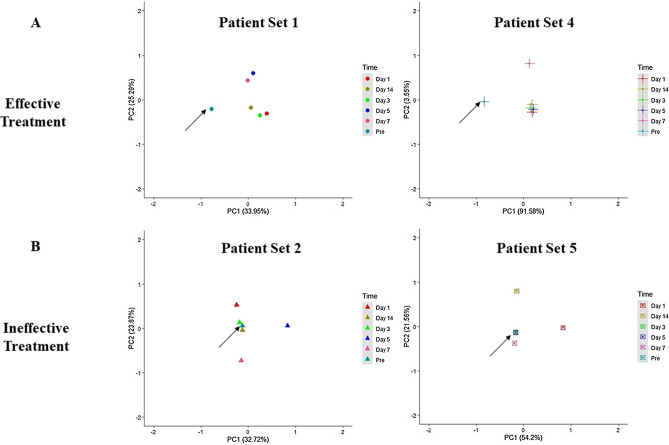
Figure 1.
Principle Component Analysis (PCA) plots. The plots show the first and second principal components of the Mtb transcriptional profile from each patient at different time points of treatment (Pretreatment to 14 days’ post-treatment initiation). PCA shows the complete transcriptome in a single point, and each point on the plot represents the Mtb mRNA profile derived from the one patient mask sample at each time point. The top row (A) represents PCA plots of patient sets with effective treatment, and the bottom row (B) represents PCA plots of patient sets with ineffective treatment. The arrow marks the pretreatment point on the PCA plots.

