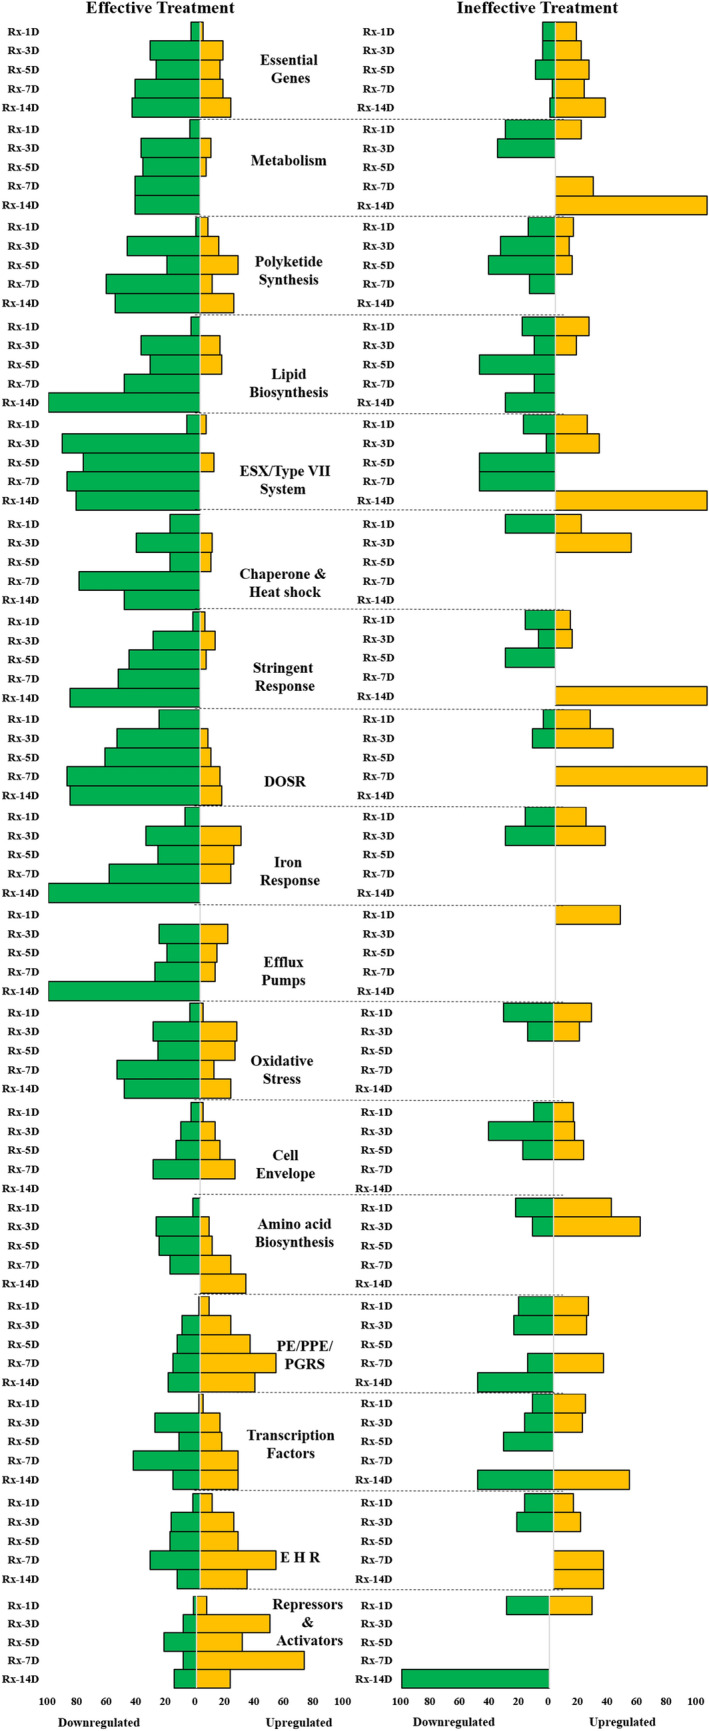
Figure 2.

Change in expression of selected functional categories of genes after initiation of anti-tuberculosis treatment. The graphs illustrate the percentage of genes in each functional category significantly up- (yellow) or down- (green) regulated each day relative to pretreatment expression. The left and right side graphs represent the alterations observed in gene expression with effective and ineffective treatment, respectively. The dashed line demarcates each of the functional categories. The percentage of genes was calculated by dividing the number of genes up or down-regulated by the number of genes detected. This calculation was for genes detected at each profiled time point in the functional group.
