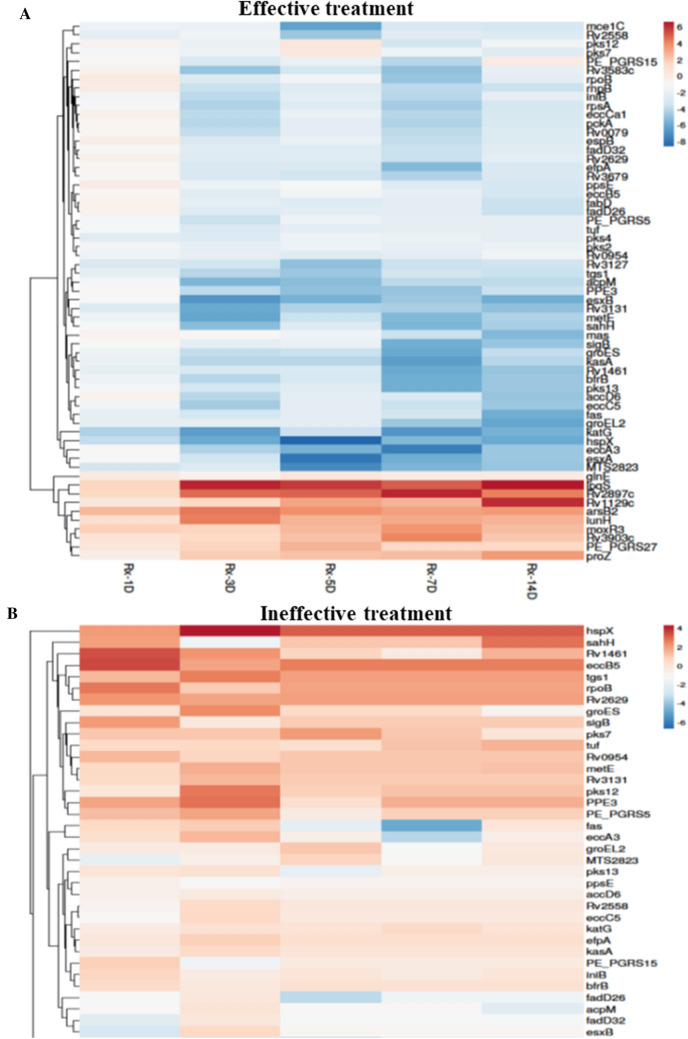
Figure 3.
Heat map of fold-change genes differentially expressed between Days 1 to 14 of treatment. The top image (A) denotes the heat map of Mtb-specific genes evaluated in patients who received effective treatment, and the bottom image (B) denotes the heat map of Mtb-specific genes evaluated in patients who received ineffective treatment. The heat maps were generated with log2 fold change values using the Clustvis web tool. No scaling was applied to rows. Imputation was used for missing value estimation. Rows were clustered using Euclidean distance and average linkage.

