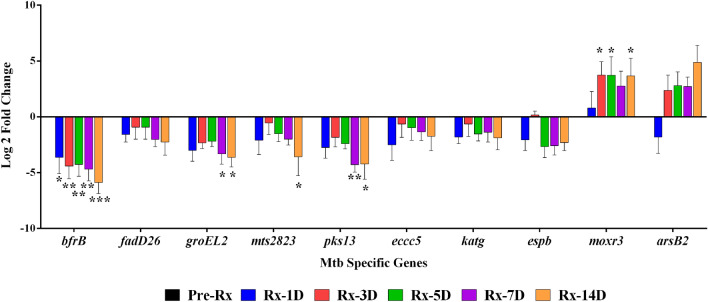
Figure 4.
Validation of the ten differentially expressed genes in ten patient sets by qRT-PCR. The graph shows the change in Mtb-specific genes' expression during different treatment days in 10 patient samples relative to pretreatment. The data were normalized using 16S as housekeeping, and relative gene expression was calculated by the ΔΔCt with pretreatment (Pre-Rx) as control. Asterisks indicate a significant difference in gene expression between days of treatment compared to pretreatment, with p < 0.05 considered statically significant. Average log2 fold change values are plotted; the error bars mark standard deviation. *p < 0.05, **p < 0.01, ***p < 0.001.

