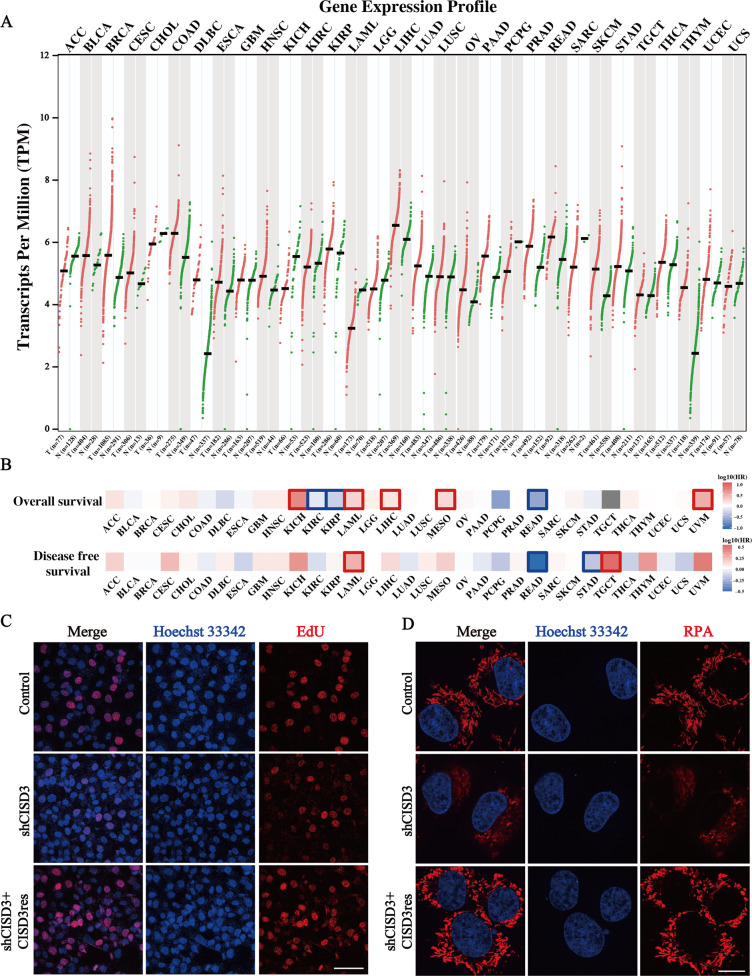
Fig. 1. Association of CISD3 expression with cancer progression and iron metabolism.
A Gene expression profile of CISD3 in various kinds of TCGA cancers and its homologous normal samples, which is obtained from the GEPIA website (http://gepia.cancer-pku.cn/index.html). B CISD3 expression was classified into two subgroups (high or low group) using the median level of CISD3 expression as the cut-off value. Survival map of Hazards Ratio (HR) for overall survival (OS) and disease-free survival (DFS) according to the low and high expression levels of CISD3 mRNA. C The proliferation of HT-1080 cells with different CISD3 expressions was detected by the EdU incorporation assay. Nuclei were visualized with Hoechst 33342. Scale bar: 50 μm. D Mitochondrial iron levels measured by RPA staining in control, shCISD3, and CISD3res HT-1080 cells and images were captured by confocal microscopy. Scale bar: 5 μm.

