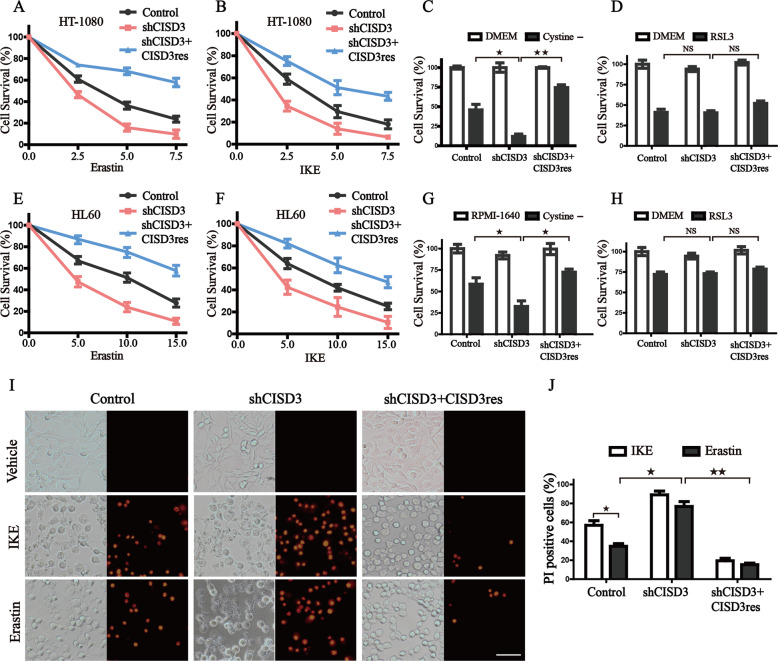
Fig. 2. CISD3 linkage to cystine-deprivation induced ferroptosis.
The HT1080 cells were exposed to titration of cystine/glutamate antiporter inhibitor erastin (A), and IKE (B) for 12 h, cystine-free media (C) for 24 h, or 0.5 μM RSL3 for 6 h (D), respectively. Cell survival was measured by CCK8 assay. Cell survival of HL-60 cells with different CISD3 expression was measured after exposure to indicated concentrations of erastin (E) and IKE (F) for 12 h, cystine-free media (G) for 24 h, or 0.1 μM RSL3 (H) for 12 h. I, J Indicated cells were exposed to 5 μM IKE or erastin for 12 h and subjected to PI staining. The images were captured by fluorescent microscopy and PI-positive cells were analyzed using Image J software. The scale bar in the cell image indicates 50 µm. The values are presented as means ± SD from three independent experiments. *P < 0.05, **P < 0.01 versus control or between different groups with altered CISD3 expression.

