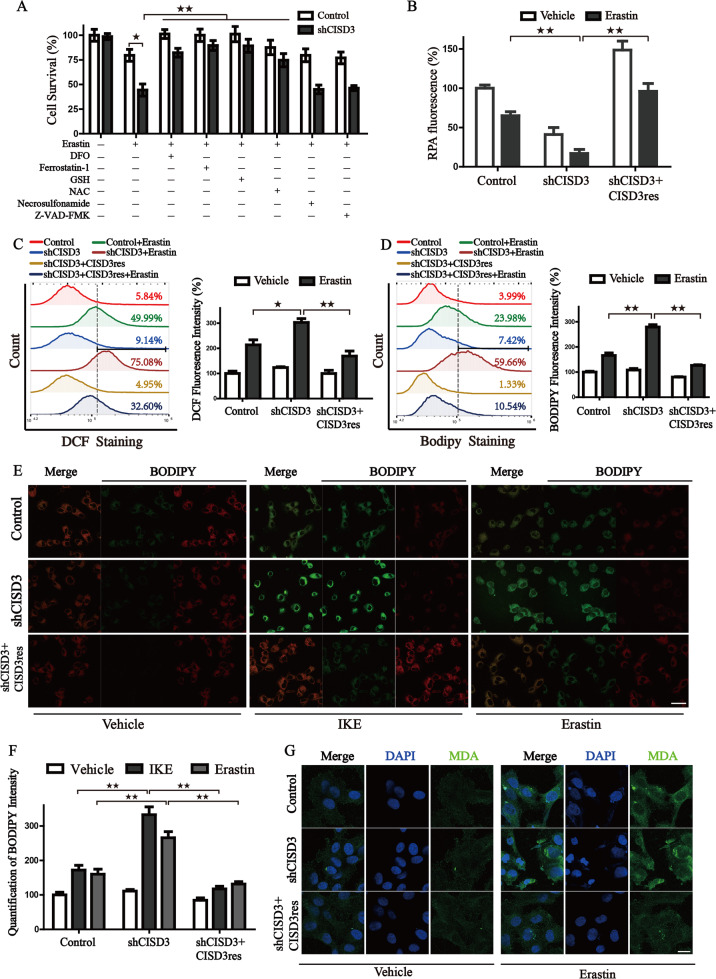
Fig. 3. CISD3 Knockdown promotes the accumulation of lipid peroxides and free iron.
A Control and CISD3 depletion cells were treated with DMSO or 7.5 μM erastin for 6 h in the presence or absence of several small molecular inhibitors (100 µM DFO, 1 µM ferrostatin-1, 0.5 mM GSH, 0.5 mM NAC, 0.5 µM Necrosulfonamide, 5 µM Z-VAD-FMK). The cell viability was detected by CCK8 assay. B Cellular ferrous ion levels were assayed by RPA staining in the cells exposed to 7.5 μM erastin for 6 h. The error bars represent the standard deviation from three replicates. HT1080 cells with different CISD3 expressions were treated with or without erastin (7.5 μM). Flow cytometric analysis of cellular ROS through DCF-DA staining (C) and cellular lipid peroxides through BODIPY C11 staining (D), corresponding statistical histograms are shown on the right. E Representative BODIPY C11 staining images of HT-1080 cells treated with or without Erastin (7.5 μM) and IKE (7.5 μM). A shift from red to green fluorescence indicates the accumulation of lipid peroxides. Scale bars: 30 μm. F Corresponding statistical histogram is shown. G HT-1080 cells were incubated with DMSO or erastin (7.5 μM) for 6 h, followed by immunofluorescence (IF) assay. The antibody against MDA was used to track the production of lipid peroxides. Nuclei were visualized with DAPI. Scale bar: 10 μm. *P < 0.05, **P < 0.01 versus control or between indicated groups.

