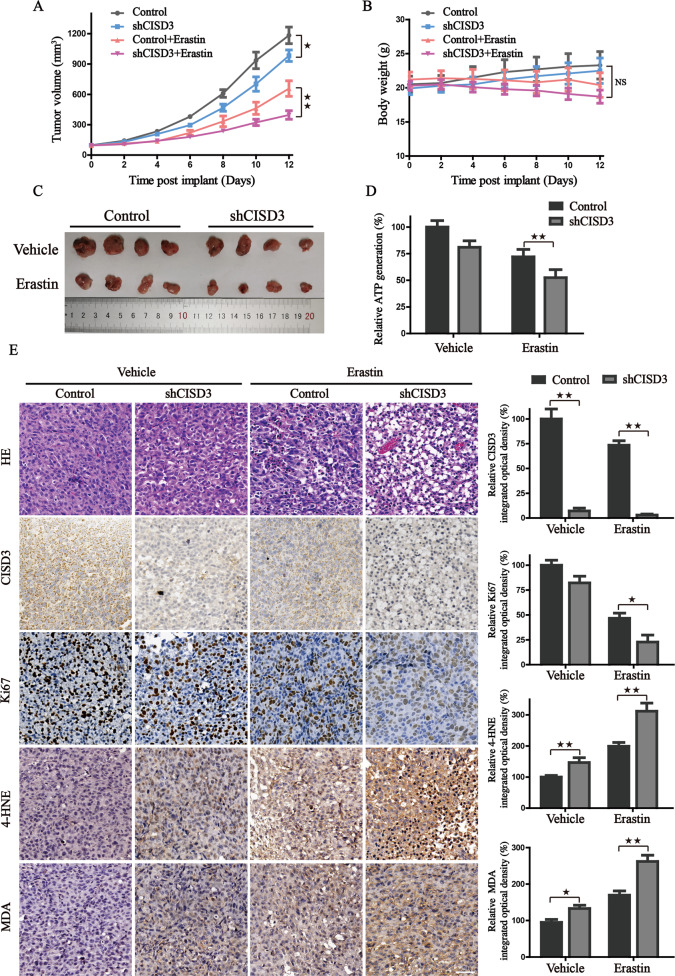
Fig. 8. CISD3 knockdown inhibits in vivo growth of xenograft.
A The growth curves representing the average size of xenografts in mice harboring HT1080 cells with altered CISD3 expression in the presence or absence of erastin administration. Tumor volume was monitored every two days and calculated using the formula: 0.5 × a × b2. B The body weight curves of mice in indicated groups. NS indicates no statistical significance. C The morphological images of dissected xenografts in indicated groups. D Xenografts in each group were lysed and the ATP content was analyzed. E H&E staining and IHC analysis for CISD3, Ki-67, 4HNE, and MDA in indicated tumor tissues. Representative images were showed and the statistical columns were quantified via relative integrated optical density (IOD) value and showed on the right. *P < 0.05, **P < 0.01 between indicated groups.

