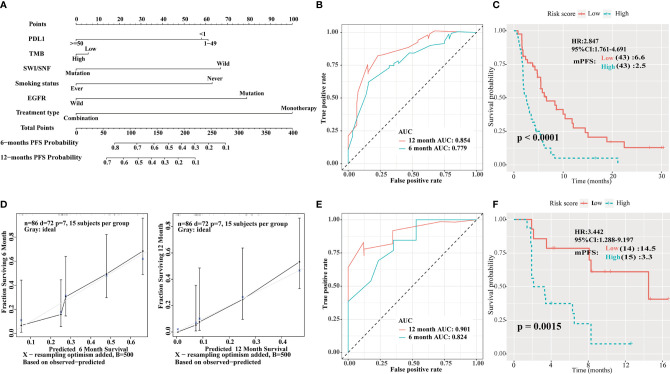
Figure 5.
Construction of an integrated prognostic classifier model. (A) Nomogram based on programmed death ligand 1 (PD-L1) score, tumor mutation burden (TMB), human switch/sucrose nonfermentable (SWI/SNF) mutation status, smoking history, epidermal growth factor receptor (EGFR) mutation status, and treatment type of the Rizvi cohort. (B) Receiver operating characteristic (ROC) curves for predicting progression-free survival (PFS) of the nomogram in the Rizvi cohort. (C) Calibration plot of the nomogram for the probability of PFS at 6 (left) and 12 (right) months in the Rizvi cohort. (D) Survival curve of PFS with the nomogram in the Rizvi cohort. The risk score was calculated according to the regression coefficient. The cohort was divided into low- and high-risk score groups for Kaplan-Meier curve analysis. (E) ROC curves for predicting PFS of the nomogram in the Naiyer cohort. (F) Survival curve of PFS with the nomogram according to the risk score in the Naiyer cohort.

