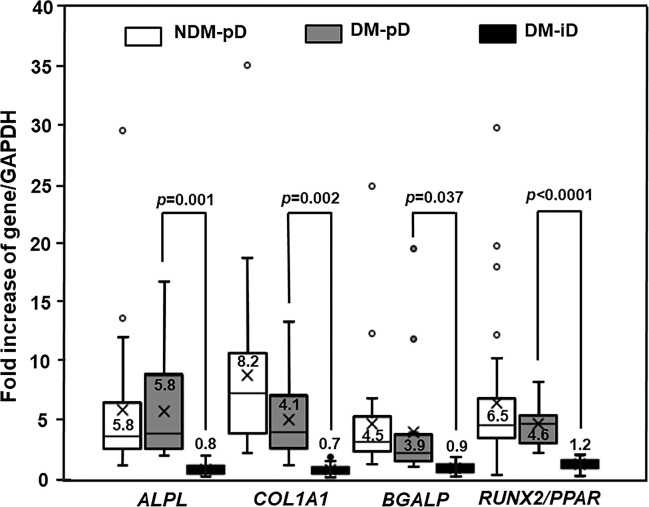
Figure 1.
Osteogenic differentiation marker expression. Box and whisker plots to show comparison of osteoblast-specific gene expression in participants without diabetes showing preserved osteogenic differentiation potential (NDM-pD), patients with diabetes showing preserved osteogenic differentiation potential (DM-pD) and patients with diabetes showing impaired osteogenic differentiation potential (DM-iD)(mean ± SD). DM-pD had higher levels of expression of ALPL, COL1A1, BGLAP and RUNX2/PPARγ ratio (RUNX2/PPAR) than those in DM-iD by 7.3, 5.9, 4.3 and 3.8 times, respectively. DM-pD had significantly higher levels of expression of all osteoblast-specific genes than those in DM-iD but had comparable levels of expression of all osteoblast-specific genes to those in NMD-pD.

