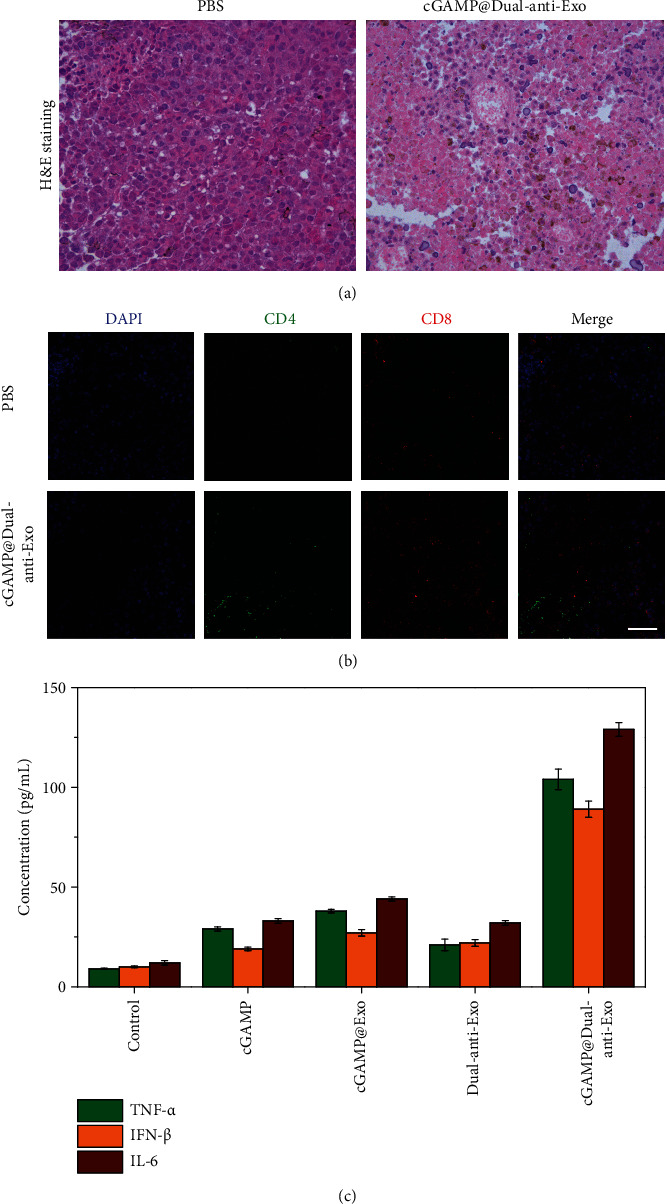
Figure 5.

(a) H&E staining of tumor sections from tumor-bearing mice after intratumor injection of different drugs. (b) Immunofluorescence staining of the tumor sections. Red and green show CD8+ T cells and CD4+ cells, respectively, and blue shows the cell nucleus stained with DAPI. Scale bar: 100 μm. (c) The expression level of TNF-α, IFN-β, and IL-6 in peripheral blood of tumor-bearing mice after intratumor injection of different drugs.
