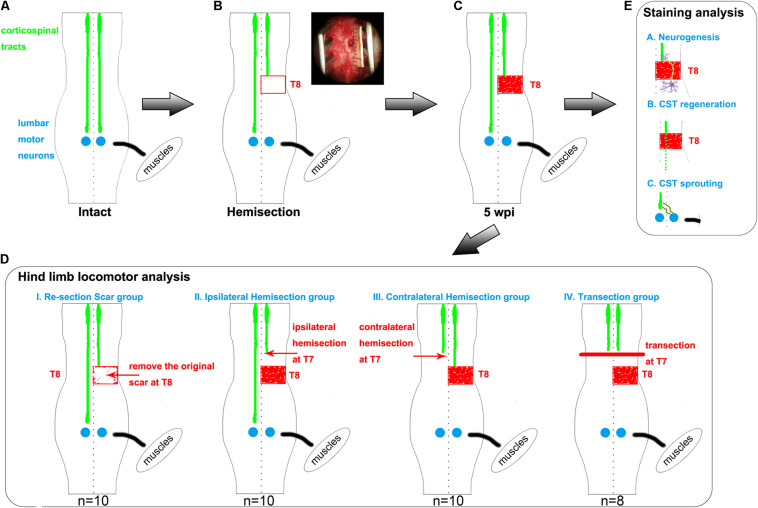
FIGURE 1.
Hemisection model and different second operations for each group. (A–C) The establishment of hemisection model rats. (A) represents intact rats. (B) represents hemisection model rats that underwent a right hemisection at the T8 level. The red rectangle symbolizes the hemisection injury with a width of 2 mm. In the upper right corner, the surgery photo is taken under a microscope, visually displaying a full unilateral (right) hemisection operation. The red-filled rectangle in panel (C) indicates the scar observed five weeks post the hemisection injury. (D) Five weeks after the first hemisection operation at the T8 level, four different second operations are further established based on hemisection model rats. The red arrows indicate the second hemisection operation. The thick red line indicates a transection. The Re-section Scar group (n = 10) underwent a second hemisection operation at the original injury site to remove the scar. The Ipsilateral Hemisection group (n = 10) underwent a second hemisection operation on the ipsilateral side at T7. The Contralateral Hemisection group (n = 10) underwent a second hemisection operation on the contralateral side at T7. The Transection group (n = 8) underwent a transection operation at T7. (E) represents the possible mechanisms of the spontaneous locomotor recovery in hemisection model rats, including neurogenesis, CST axon regeneration, and CST axon sprouting. CST indicates the corticospinal tract.

