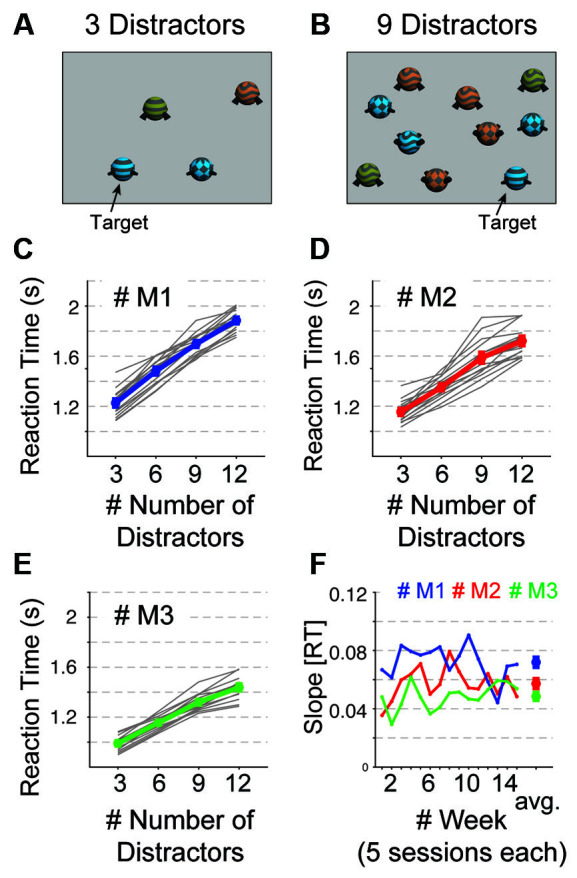
Figure 3.

Visual search performance. (A,B) Visual display with a target object and 3 (A) and 9 (B) distractor objects that shared features with the target. (C–E) Visual search reaction times (Y-axis) for 3–12 distractors (x-axis) in each of 15 weeks (gray lines) and on average (colored line) for monkey M1 (C), M2 (D), and M3 (E). (F) The regression slope or the reaction time increase with distractors for each monkey (in color) over 15 weeks. The rightmost data point is the average set size effect for each monkey. Error bars are SEM.
