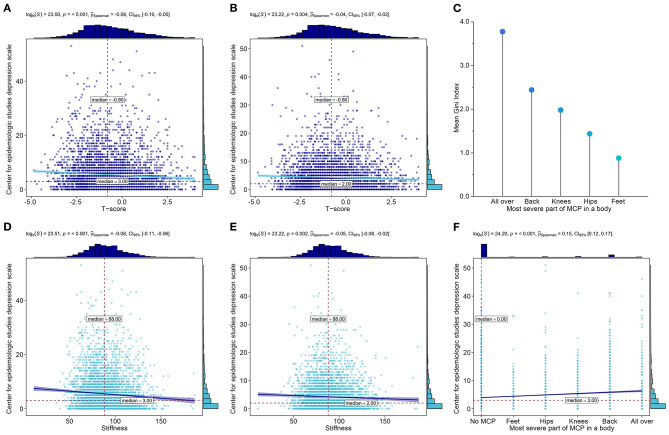
Figure 3.
Further analyses for osteoporosis and MCP. (A) Association between T-score and depressive symptoms at baseline. (B) Association between T-score and depressive symptoms at Wave 2. (C) Mean Gini Index quantified the contributions of different body parts with the most severe MCP. (D) Association between stiffness and depressive symptoms at baseline. (E) Association between stiffness and depressive symptoms at Wave 2. (F) Association between the most severe body part of MCP and depressive symptoms at Wave 2.

