FIGURE 4.
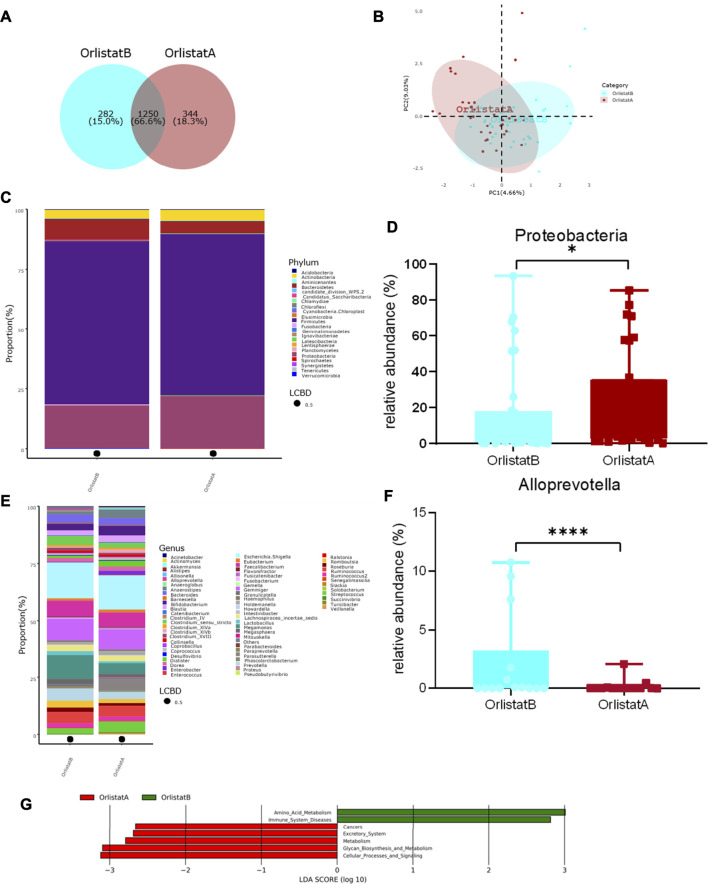
Alterations of gut microbiota before and after orlistat intervention. (A) Venn diagram of shared OTUs before and after orlistat intervention. Numbers represent the number of shared OTUs, the percentage represents the proportion of shared OTUs to total OTUs. (B) Beta-diversity was visualized by PLS-DA analysis at family level. (C,D) Bar plot of gut microbiota composition at phylum level and the relative abundance of Proteobacteria was significantly increased after intervention by Metastas analysis. *p < 0.05. (E,F) Bar plot of gut microbiota composition at genus level and the relative abundance of Alloprevotella was significantly decreased after intervention by Metastas analysis. ****p < 0.0001. (G) LDA scores for differentially abundant predicted microbial pathways and classified functional categories (Log10 LDA scores >2) before and after intervention. OrlistatB, before intervention, n = 32. OrlistatA, after intervention, n = 32.

