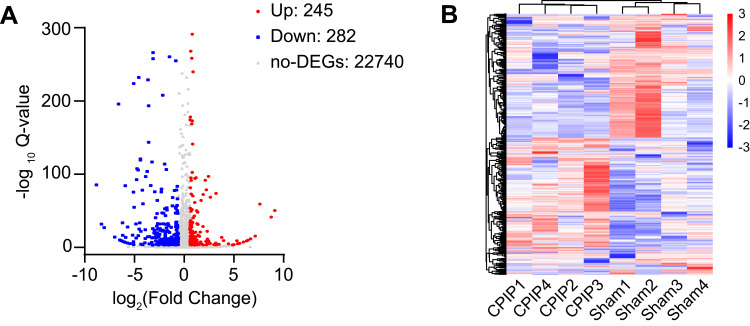
Figure 3.
Gene expression profiling by RNA-Seq in contralateral DRG of CPIP model rats. (A) Volcano plot illustrating gene expression profiles in contralateral DRG of CPIP model group vs sham group. Red and blue dots show up- and down-regulated DEGs, respectively. Gray dots indicate non-DEGs. (B) Heat map showing the hierarchical clustering of DEGs from CPIP and sham groups and within groups.
Abbreviations: RNA-Seq, RNA-sequencing; DRG, dorsal root ganglia; CPIP, chronic post-ischemic pain; DEGs, differentially expressed genes.

