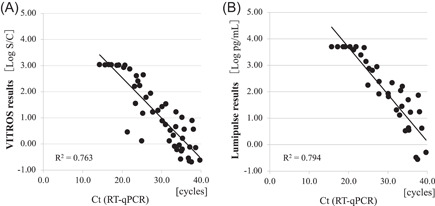
Figure 1.

Correlations between Ct values obtained with reverse‐transcription polymerase chain reaction (RT‐qPCR) and antigen levels obtained by each automated antigen‐detection test. The antigen level in (A) the VITROS® SARS‐CoV‐2 Antigen Test and (B) the LUMIPULSE® SASR‐CoV‐2 Ag Test were plotted relative to RT‐qPCR Ct value. The diagonal line shows the cut‐off value
