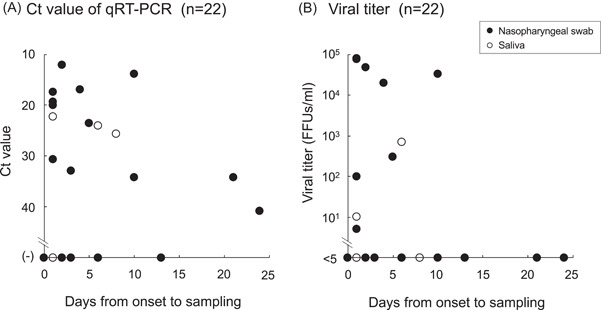
Figure 3.

(A) and (B) Cycle threshold (Ct) values (A) and infectious virus titers (B) in nasopharyngeal swab (NPS) (closed circle) and saliva (open circle) samples on the day of sample collection after the onset of COVID‐19 symptoms. COVID‐19, coronavirus disease 2019; qRT‐PCR, quantitative reverse‐transcription polymerase chain reaction
