FIGURE 5.

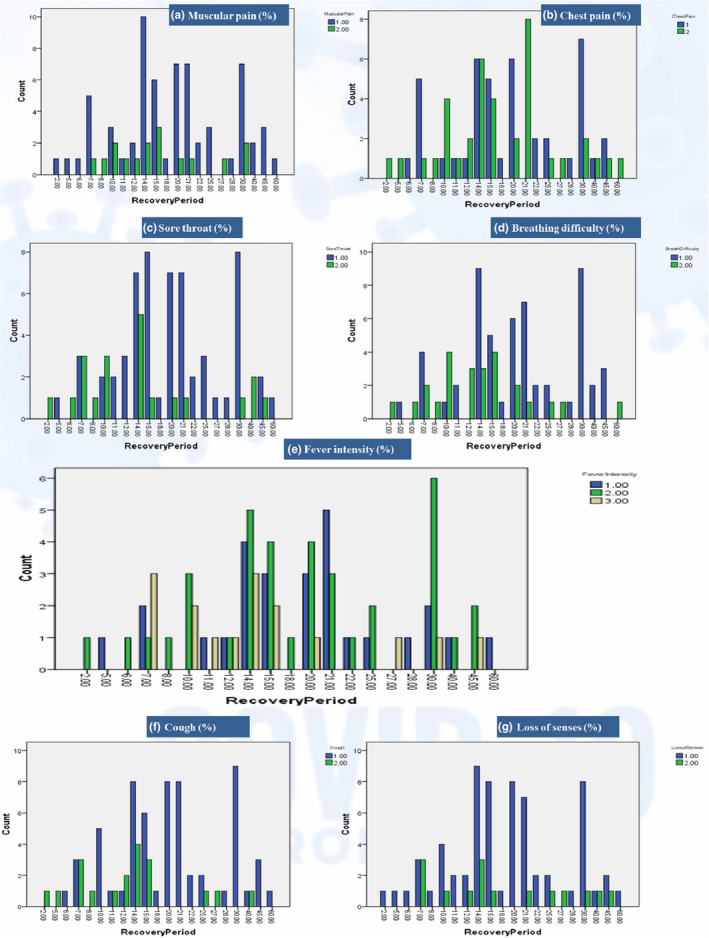
Apparent symptoms distribution along recovery period. *a, b, c, d, f, g (1 = yes, 2 = no); e (fever intensity [1 = high, 2 = moderate, 3 = mild])

Apparent symptoms distribution along recovery period. *a, b, c, d, f, g (1 = yes, 2 = no); e (fever intensity [1 = high, 2 = moderate, 3 = mild])