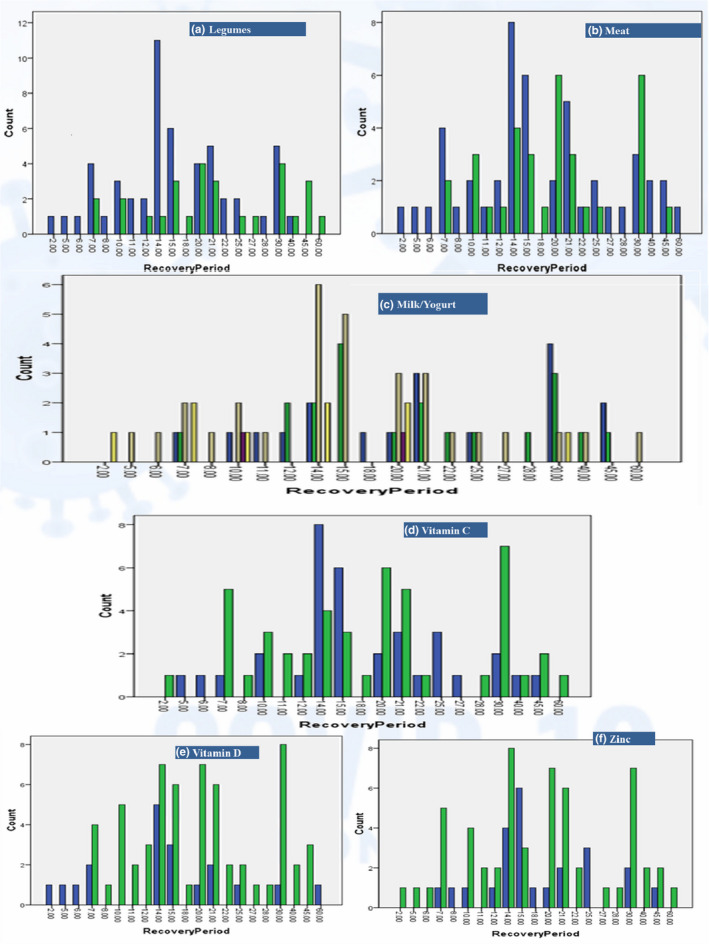
FIGURE 7.

Major food and supplements consumption distribution along recovery period. *a, b, d, e, f (1 = yes, 2 = no); c (0.5 to 3 portions, where 1 portion =150 ml)

Major food and supplements consumption distribution along recovery period. *a, b, d, e, f (1 = yes, 2 = no); c (0.5 to 3 portions, where 1 portion =150 ml)