Figure 1.

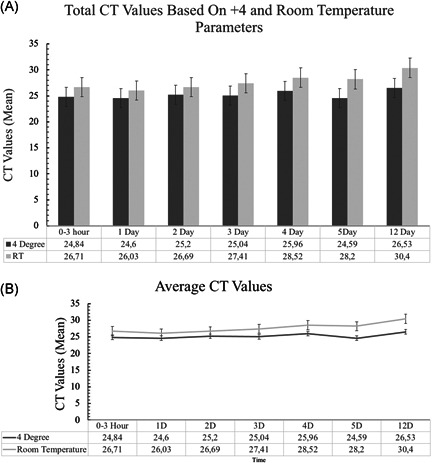
(A) and (B) Means and 95% confidence interval of CT values for both temperature conditions through all the studies. Mean values are also presented at the bottom of the diagrams

(A) and (B) Means and 95% confidence interval of CT values for both temperature conditions through all the studies. Mean values are also presented at the bottom of the diagrams