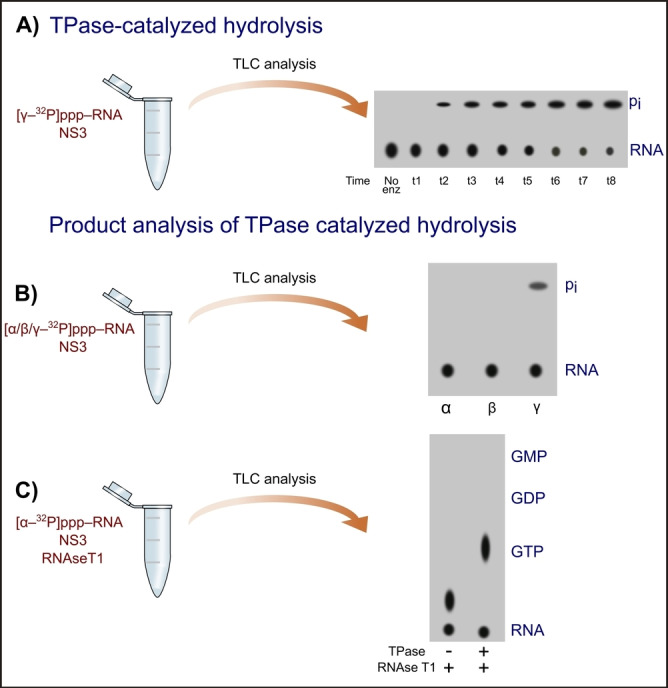
Figure 3.

Schematic diagram of radioactive assays for TPase characterization. Illustrations were prepared using Inkscape software based on experimental results from Bartelma et al. 2002. [71] The pi symbol corresponds to the phosphate moiety. A) Monitoring of (NS3) TPase activity using TLC analysis to separate products and autoradiography to visualize products. B) TPase product analysis using α‐, β‐, or γ‐32P‐labelled RNA 5′ triphosphate; C) TPase product analysis using [α‐32P]‐labelled RNA 5′ triphosphate and RNAse T1.
