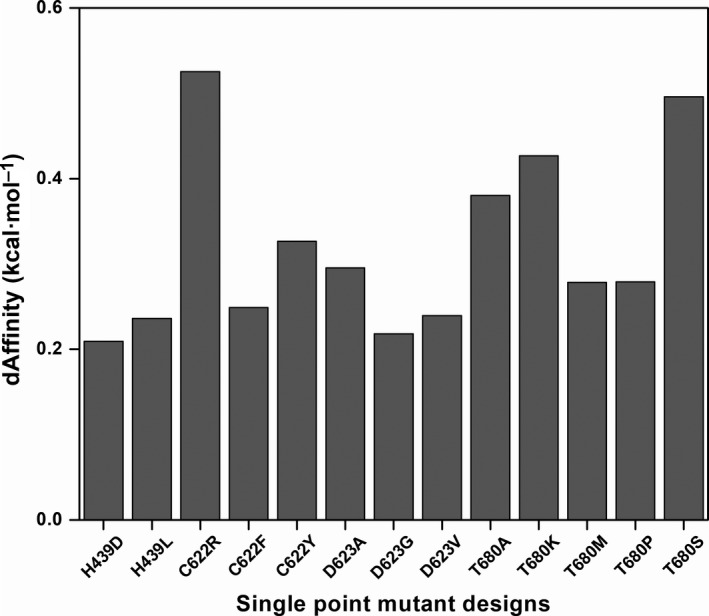
Fig. 4.

Relative binding affinities of the potential designs for favipiravir resistance. Bar plot showing the dAffinities for the most plausible favipiravir‐interacting nsp12 residues and their single‐point mutant designs. These designs exhibited dAffinities higher than 0.2 kcal·mol−1, suggesting potential resistance to favipiravir. Here, a large positive increase in the dAffinity value indicates that the mutation decreased the affinity of nsp12 towards favipiravir and hence could develop resistance for the ligand. This dAffinity cut‐off was considered for a clear interpretation of affinity‐attenuating mutants and distinguishing them from other mutants.
