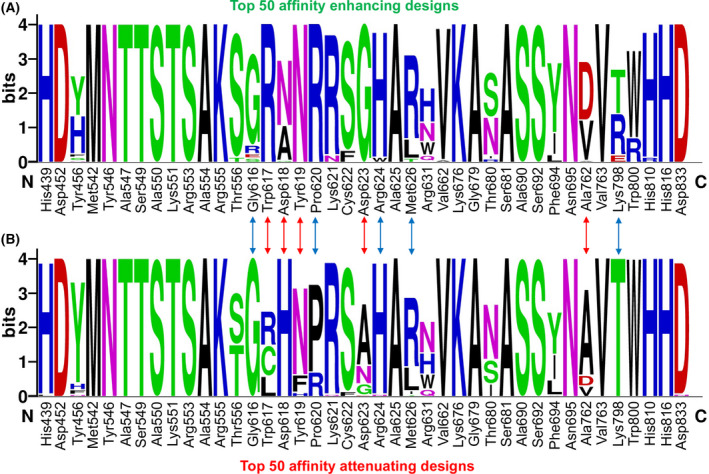
Fig. 6.

Sequence logos showing the type and frequency of designed favipiravir‐nsp12 interacting residues. Sequence logos of the 50 top‐scored (A) affinity‐enhancing vs. (B) affinity‐attenuating designs are displayed. The X‐axis represents the native nsp12 residue index, and the Y‐axis shows the sequence conservation at that position. The height of symbols indicates the relative frequency of a particular amino acid at that position. The red arrow denotes residues that experienced diverse sequence variations with a relatively higher number of sampled amino acids, whereas the blue arrow denotes residues that exhibited diverse mutations but with fewer amino acids sampled.
