Fig. 9.

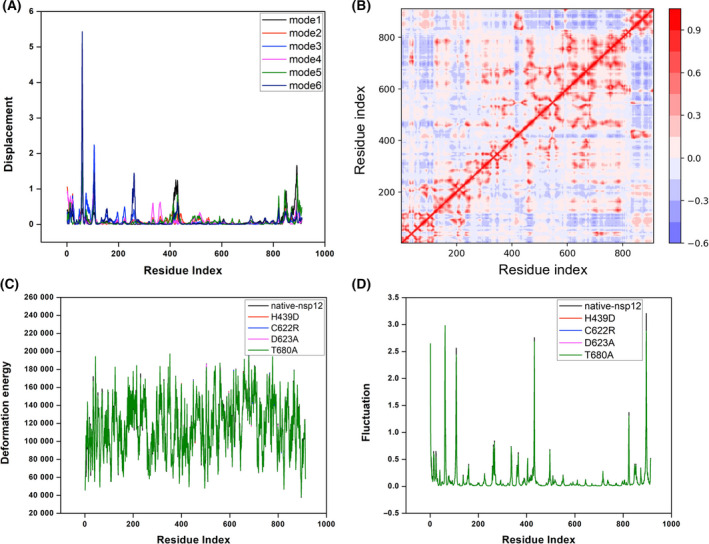
Normal mode analysis of native nsp12 and certain affinity‐attenuating designs. (A) The atomic displacement of each C⍺ atom for modes 1–6. (B) The residue correlation matrix showing the correlated movement of the C⍺ atoms in nsp12. In the plot, each cell indicates the coupling of two residues ranging from −1 (anticorrelated, blue) to 0 (uncorrelated) to 1 (correlated, red), thus representing correlated motions. (C) The normalized deformation energies per C⍺ averaged over the normal modes for the native nsp12, and certain affinity‐attenuating designs are shown and labelled. (D) The squared atomic fluctuations for each C⍺ atom are normalized and shown so that the sum of all C⍺ in a sequence is 100. The profiles for the native nsp12 and certain affinity‐attenuating designs are labelled to understand the effect of mutations.
