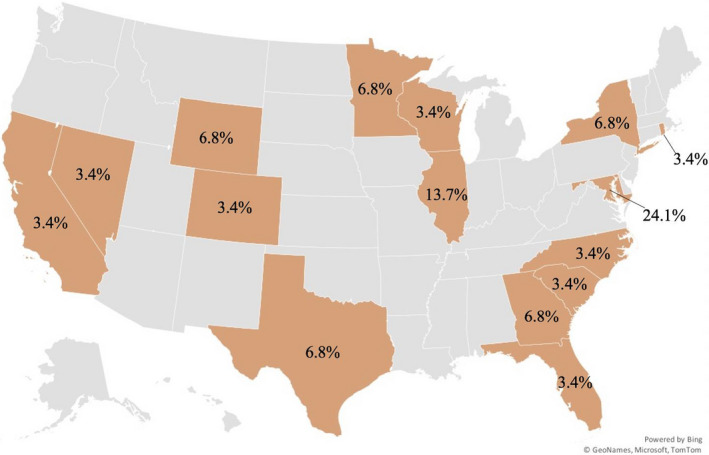
Fig. 1.

States represented by mentor focus group participants. Note: This map only includes data on 75% of participants, as 25% did not indicate their location. In addition, Maryland disproportionately represents a quarter of the geographic data due to the research team’s location, visibility in the state, and their personal connections with local mentoring organizations
