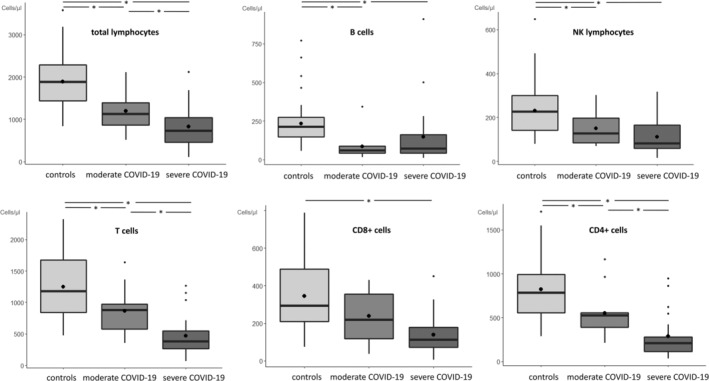
FIGURE 1.

Distribution of counts of total lymphocytes and main subtypes are stratified by healthy controls (light gray), moderate COVID‐19 (medium gray), and severe COVID‐19 (dark gray) patients. Black lines and black points in boxplot represent median and mean values, respectively. *p < 0.05 significant value
