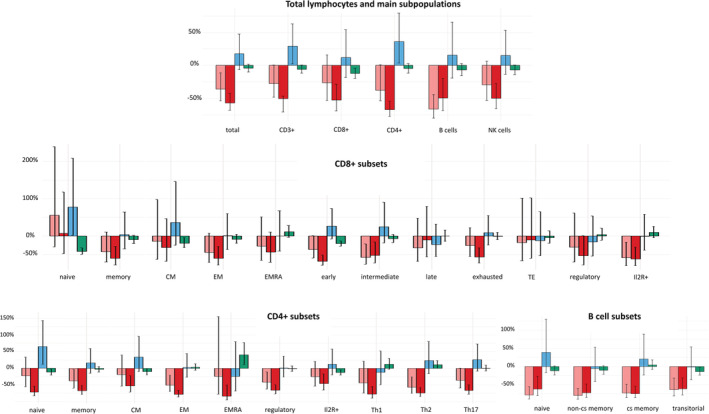
FIGURE 3.

Impact of moderate/severe COVID‐19 (bright red/red) as well as gender (blue) and age (green) on lymphocyte counts were estimated in multivariate analysis. Levels of COVID‐19 columns indicate percentage deviation from normal values of healthy controls. Blue columns indicate mean percentage influence of female gender. Levels of age columns reflect percentage deviation per 10 years. Black bars in columns present 95% confidence interval
